START TRADING 101 | Lesson 5
The Way a Market Wizard from New York is Taking Profits will Amaze You
First of all, congratulations on making it this far! You should have finished 4 lessons by now… you passed hump day 🙂
Lesson 5 is probably the second most important lesson – it’s about how to take profits from your trades (quick hint: Lesson 6 is the most important one, so don’t skip it!).
By now you know that I do not believe that stock picking is the most important part of trading – which might make you wonder about
1) can you prove it and
2) what is the most important part of trading instead?
A very successful New York trader (a so-called market wizard) wanted to test this idea after being challenged about it by a student. Here is what the student asked him:
“If stock picking is not important, could you just pick stocks randomly and still make profits?”

Tom Basso (the wizard’s name) decided to figure it out by running thousands of simulations over 10+ years of data. His system looked like that:
- Choose randomly whether to buy or short sell a security
- Set a stop price
- Buy a limited amount per trade
The result?
His system was profitable 100% of the time!
That’s pretty impressive and tells a lot about stock picking… and about proper risk management!
But that does not mean that stock picking is not important at all.
Simulations are not the real deal – they are just simplified models of reality, with their flaws and issues; so always take simulation results with a grain of salt. While his system made no losses, he admitted that the profits were not great.
Stock picking with an edge will greatly improve returns.
Later in this lesson, I will tell you how Tom Basso is taking profits with his trades… read on!
How I learned the value of having a stop price
One of my first trades also taught me my first lesson about stop prices.
At the time when Blackberry was still a major smartphone competitor, I reviewed their stock chart – and I thought I saw a buying opportunity (prices were low!).
At that time, I had no idea about trading – no system in place whatsoever.
I put all my cash into that one trade, thinking I hit the jackpot. No stop price, no research, nothing. Because Blackberry was what everyone was carrying around and it was a brand… right?!
A few days later… my trade was under water by approximately $2,000. And my confidence was shattered more than my trade (being an engineer, I thought I know what I am doing when it’s about numbers… think again!).
I sold at a major loss and wondered how I could have been so wrong.
The list of mistakes I made on this first trade is long (no stock picking system, no risk management, not stop price, no research, no information, thinking I must be right all the time etc.), but in this lesson, we will focus on the stop price.
Had I set a stop price that would limit my loss, it would have been a less costly lesson!
On the up side though, an expensive lesson sticks better 🙂
What we like to have
Profit taking in stock trading needs two things: knowing when to buy and knowing when to sell.
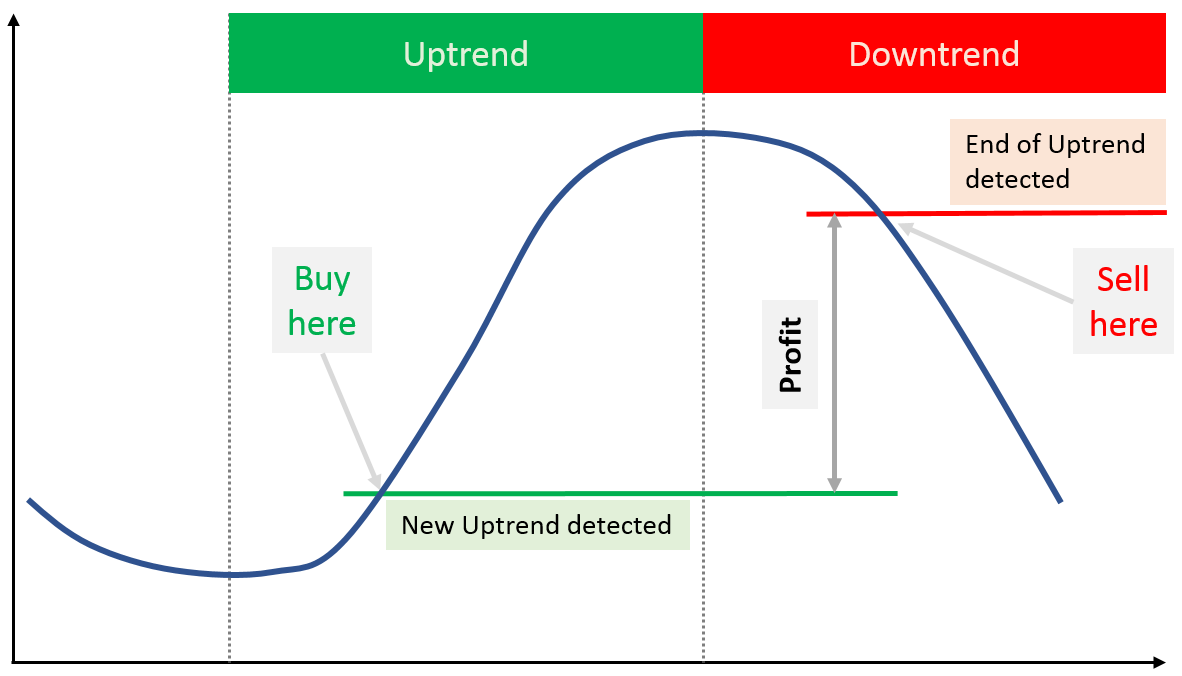
Ideally, we like to have this scenario:
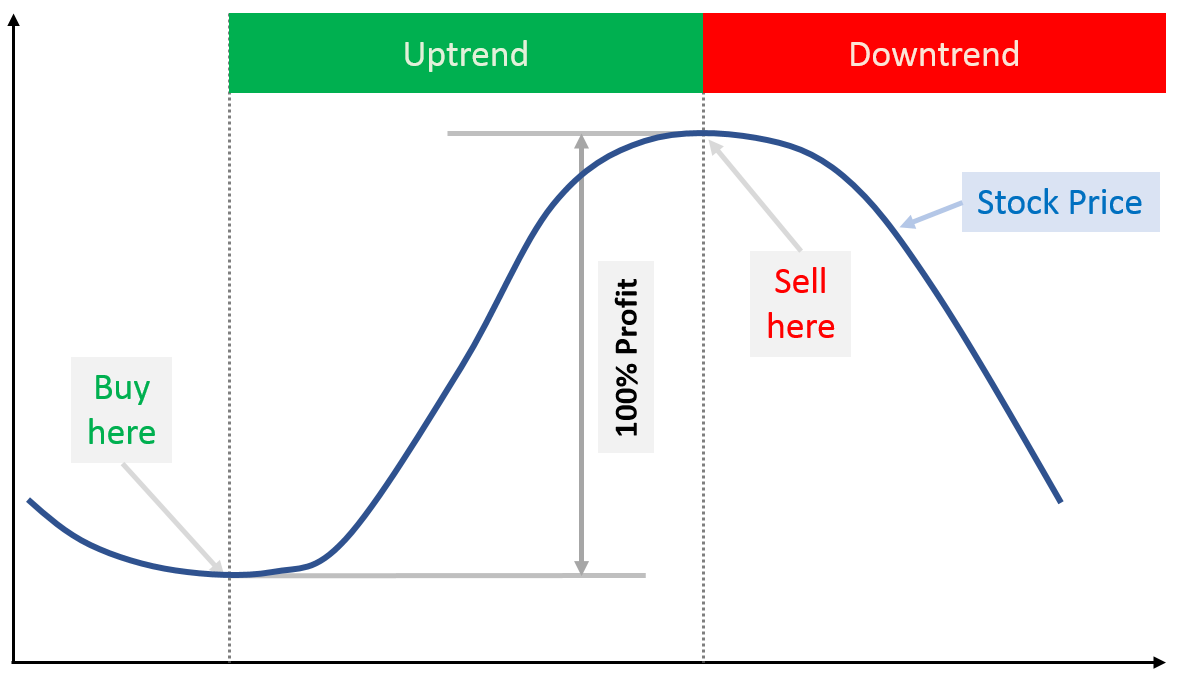
It’s classic “buy low, sell high”.
Buy when the previous downtrend is finished (at its lowest price), then hold on to the stock until it reaches the end of the uptrend and sell it at its peak price.
Unfortunately, it’s impossible.
Because we do not know the lowest price at the end of a downturn, and we do not know the highest peak of the uptrend (means, forecasting the right time is not possible).
It’s easy to look back and say, well, I should have bought here and then sold there (that’s hindsight bias at work).
But that’s not how it works. The market is complex and messy, and we do not have a crystal ball to see into the future. Instead, we see stock charts with their past data, like this one:
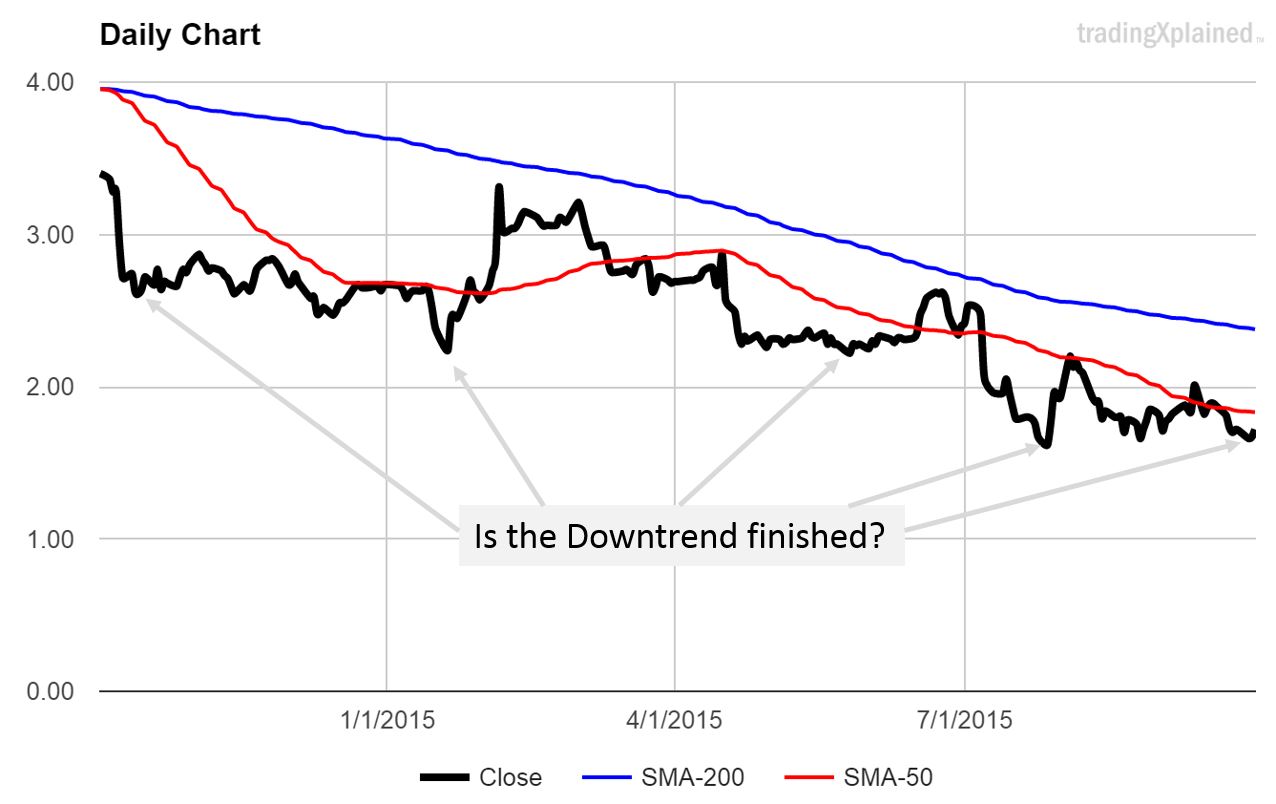
What do you see?
It’s a solid downtrend and had we assumed that it is finished at any time that is visible in this chart, we would have ended up with a loss… because it just continued to go down even further.
Fast forward several months… let’s assume that we knew when to buy at the low point. Now what?
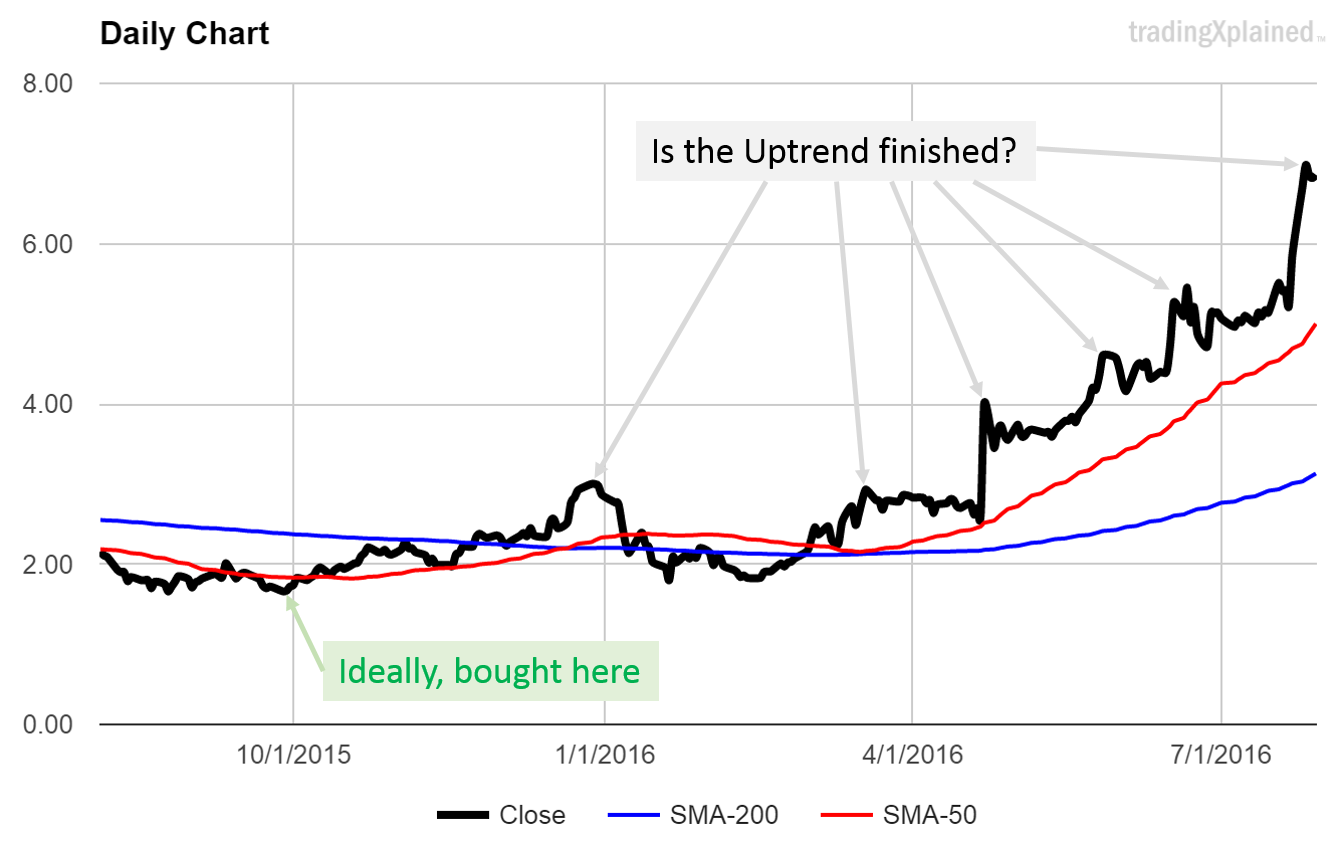
We still do not know when we should sell, as any peak could be the last one of the trend.
But selling early is dangerous. What if we miss the rest of the trend? We would leave a potentially big amount of money on the table.
So, what’s the solution?
The next best thing is… giving (some) money back
In the previous lesson, you already learned how to pick stocks systematically.
You will have noticed that to detect a potential trend, it must already be on its way… you will miss the first part of it. And that’s OK!
Selling the stock to make a profit works similarly. First, you need to detect that the trend is ending – then you decide to sell.
Detection of trends costs money… and that is completely normal.
In fact, any trend following system works in a way that parts of the potential profits are given back. Call it the cost of doing business or a terrible injustice… but accept that that’s what it is.
It is painful to see the profits that you “made” while the stock is at its peak pricing shrink until your “downtrend detector” kicks in.
It takes some time to get used to it.
Over time it will get easier though. I automated my selling and I do not check every single stock I own every day, hour or minute. Instead, I let the system do its work, and once the brokerage sends me a confirmation that a stock has been sold, I review and file it.
That’s it.
So that’s the theory 🙂 now let’s look into how to setup such a trade.
Limit and Stop Prices
We already discussed how to detect a potential uptrend.
Let’s say you have reviewed your shortlist in the evening and you found a candidate that you want to buy next day. How do you do that? And at what price would you buy?
The first question is easy. You ask your broker to do it for you, or better, you do it yourself via your online broker by creating a “Buy Order”.
The second question is a bit trickier.
There are many different types of orders. Here I will only introduce the most basic ones (as usual, complexity knows no limit, but we stick to what is needed for now):
1. Market Order
2. Limit Order
3. Stop Order
A Market Order tells the online brokerage to buy a stock at the price that is currently the best available market price.
Example:
Your selected stock had a closing (“last”) price of $100 this afternoon. Now the markets are closed and tomorrow morning they will re-open. Your log on to your online brokerage and create a new market order.
It might look like this:
“Buy 100 stocks of Company ABC at whatever is the current price”
Next morning, once the market opened, the stock price is at $101.
Because your order is in the queue already, your online broker will try to fill it as soon as possible. With the current price, you are likely to buy your stocks at $101.
It can work the other way around, too! The price might have gone down to $99 and you pay less than you expected based on yesterday’s price.
A Limit Order is an order that says, “Buy at THIS price or better, otherwise don’t buy at all”.
If you would set the price limit to $100 and the price starts at $101, your order will not be filled. If the price dips to $100 or less, your order will be filled at the price you asked for.
A Stop Order is the opposite of the Limit Order. It’s like saying, “Buy at THIS price or worse, otherwise don’t buy at all”.
Now why would you accept to buy at a worse price than a set price? For two reasons:
1) You use a breakout system and buying at a higher price confirms a trend better. If it was a random price peak and afterwards prices drop again and the trend never happens… then you avoided a loss.
2) If you want to limit your risk of a trade, you use a sell order – by using a Stop Price. That means, “Sell if the price goes below THIS price, otherwise don’t sell”.
Why use a Limit Order to buy?
It’s personal preference, really.
I always wonder: if I let my broker decide upon the price, will I get the best deal? Maybe yes… but it’s really hard to know if it’s the case.
So instead of constantly wondering, I just prefer to say, “Buy at THIS price, and if that price does not happen… never mind”.
Also, there might be a jump in overnight pricing that I do not want to tolerate. Now you might ask, what price jumps? I do not see any jumps on these charts you showed me!
And you are right, there are no obvious jumps.
That’s because of the way line charts are drawn. A line chart uses only a single daily price (the last price of the day, called the “close”) and then it connects the dots between each day.
Some chart software also applies some nice line smoothing… so it looks nicer. Below is an example of a line chart that covers one week of trading (means, 5 data points, one for each trading day).
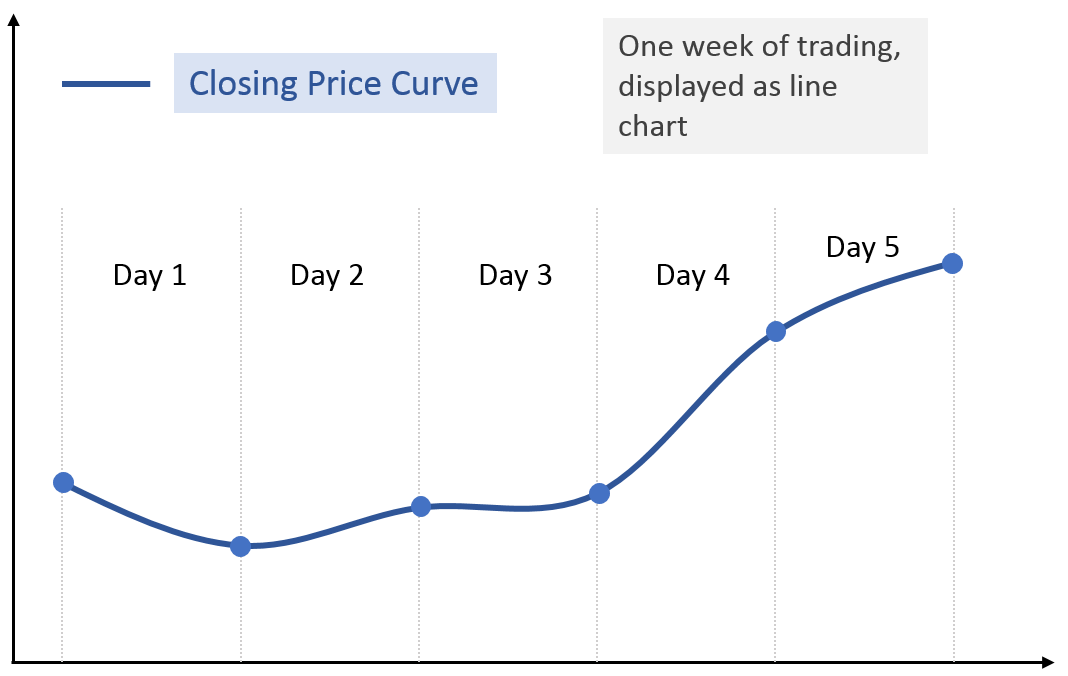
As you can see… no price jumps between the days.
But it’s a simplified version of what actually happens. Each trading day contains a lot of trading data… what happens to the price every hour, every minute, even every second.
And overnight, although there is no trading going on, price perceptions can change, causing next morning opening prices to be different from the previous closing price.
In the next chart, I display a line chart for every day – see the difference compared to the line chart based on close prices only.
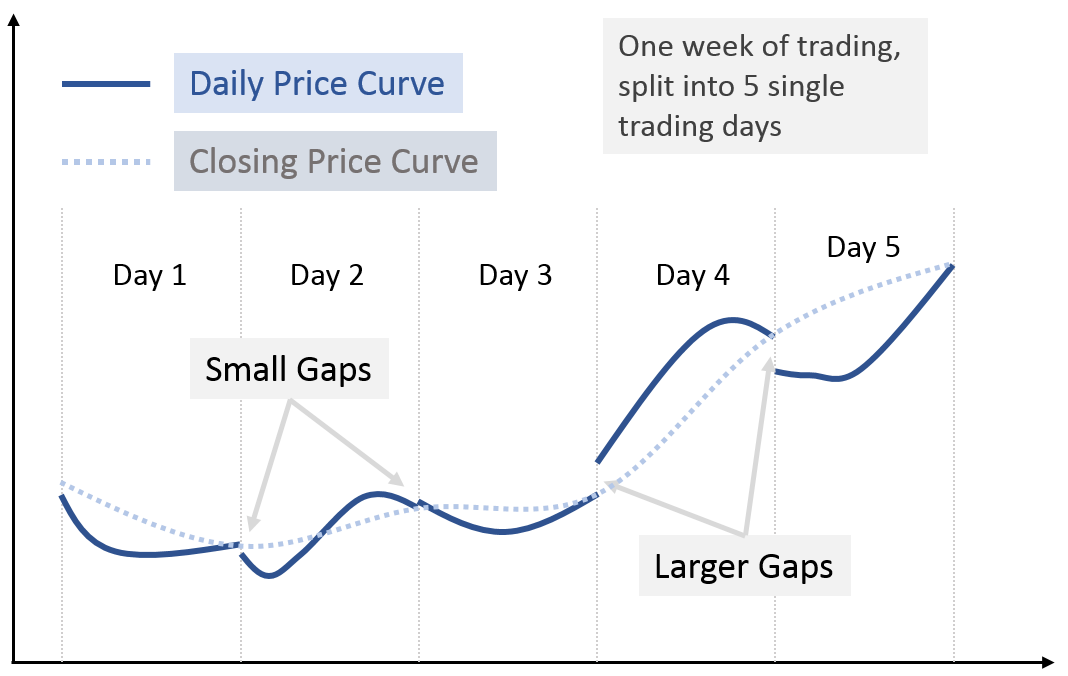
You will notice the jumps… sometimes they are tiny, sometimes quite large.
Also, the price keeps moving up and down during the trading day itself – that’s not reflected in a daily line chart. And that’s fine – more information does not really help here (unless you are a day trader, then it’s your bread and butter).
Setting a limit price when buying your stocks helps you to get the price you had in mind when making the order – and even if the price jumped up when the markets opened… it might come down during the day and you get your order filled.
Now, what if the order does not get filled during that day?
It depends:
Firstly, you can set your order in a way to stay in the queue for longer than a single day.
I usually set my order validity to “GTC” – means, good till canceled. If I missed the trade and prices do not come back to my limit price within a week or so, then I cancel the order manually (or I change the limit price if I still want to buy).
Secondly… you might miss the trade.
That’s not always a bad thing – after all, buying at a higher price will reduce profits. And there is always the next trade coming.
When using a Limit Order to buy, what should be the price?
Ideally, it’s a compromise between missing the least amount of trades and the best possible buying price.
My default limit price is the same as the previous day close price (that’s the latest price I have available on my chart). If the price jumps significantly then I miss trades – but it does not very happen often.
Could I do better if I would set my limit price lower, by a small percentage? It’s possible – that falls under system optimization and needs extensive simulation.
I will cover this topic in a later course in more detail.
It’s up to you and I encourage you to experiment with setting your limit price – just make sure you use enough samples before you come to a conclusion.
If you don’t feel like experimenting with it, that’s OK. Just set the limit at the latest price and move on.
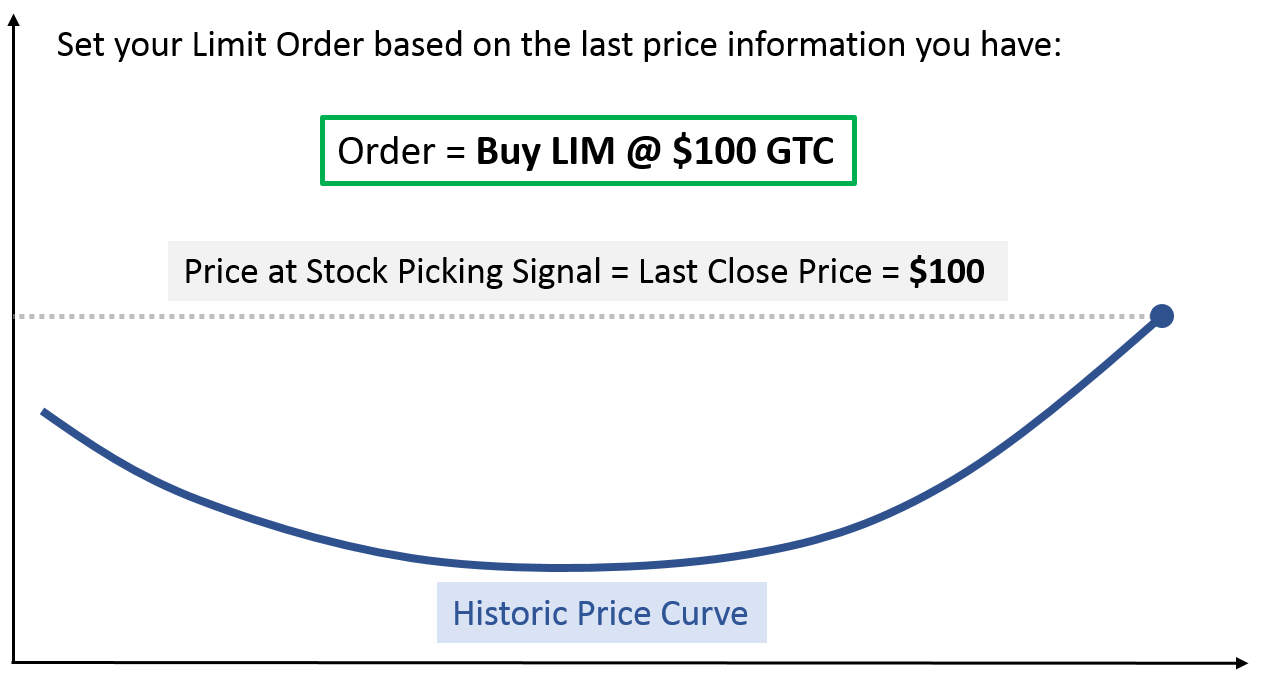
Above shows how to set the limit buy order – for setting the price at the last available price. It’s set at “Good Till Cancelled” – but that is personal preference only.
At that point, here is what happened until now:
- We detected a trend (buy signal from our stock picking system)
- We decided to buy this stock at a limit price that equals the last price we saw on the chart
- We created the order for our online brokerage to buy this stock at a price of $100 or lower, with no validity limit (in practice, your broker might automatically cancel GTC orders if they were not filled within 3 months – something to check!)
What’s next?
Now we need to set our stop price.
Setting your stop price
The stop price is a risk reduction tool – so we should discuss it in the next lesson.
But at the same time, it can be used to realize profits, which is why I will discuss it here already.
Below is an example of buying a stock at $100 while setting a stop price at $90.
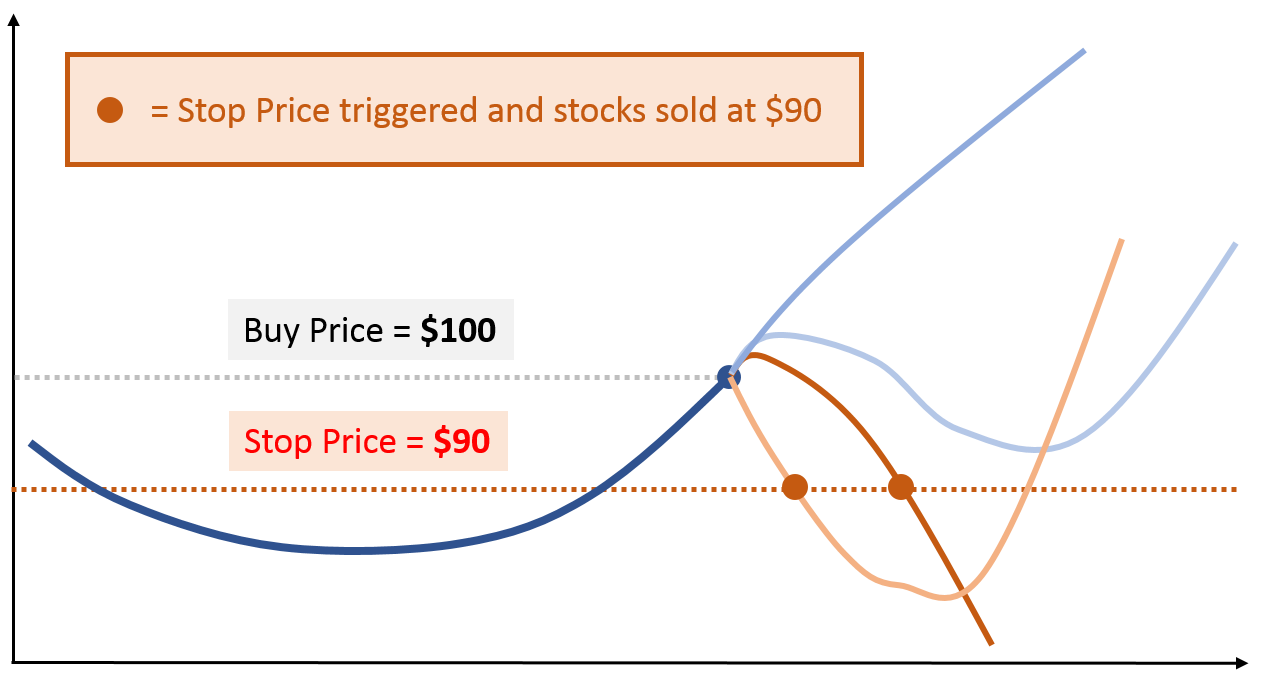
The orange and light blue curves show possible price moves after buying that stock.
For the blue curves, the stop price is not triggered because the price never goes as low as the stop price (or lower).
For both orange curves, the stop price is triggered. In case of the light orange curve, the price later recovers and goes into an uptrend – but we are not in the game anymore to benefit from it.
If the stop price is set too close to the buy price, then it is triggered very often because of the noisy up and down price moves that always happen, but that doesn’t represent the actual trend.
If the stop price is set too far from the buy price, then your losses in case of a “bad” price move will be too high.
So, what’s the “right” distance between buy price and stop price?
Short answer: around 10% is a good all-round value. 5% is coming close to noise levels, 20% means larger and maybe unnecessary losses.
Longer answer: it depends on how volatile the price curve is (i.e. how strong the noisy ups and downs are).
The first chart shows a price curve that has an uptrend but low volatility.
The second chart has the same uptrend, but high volatility.
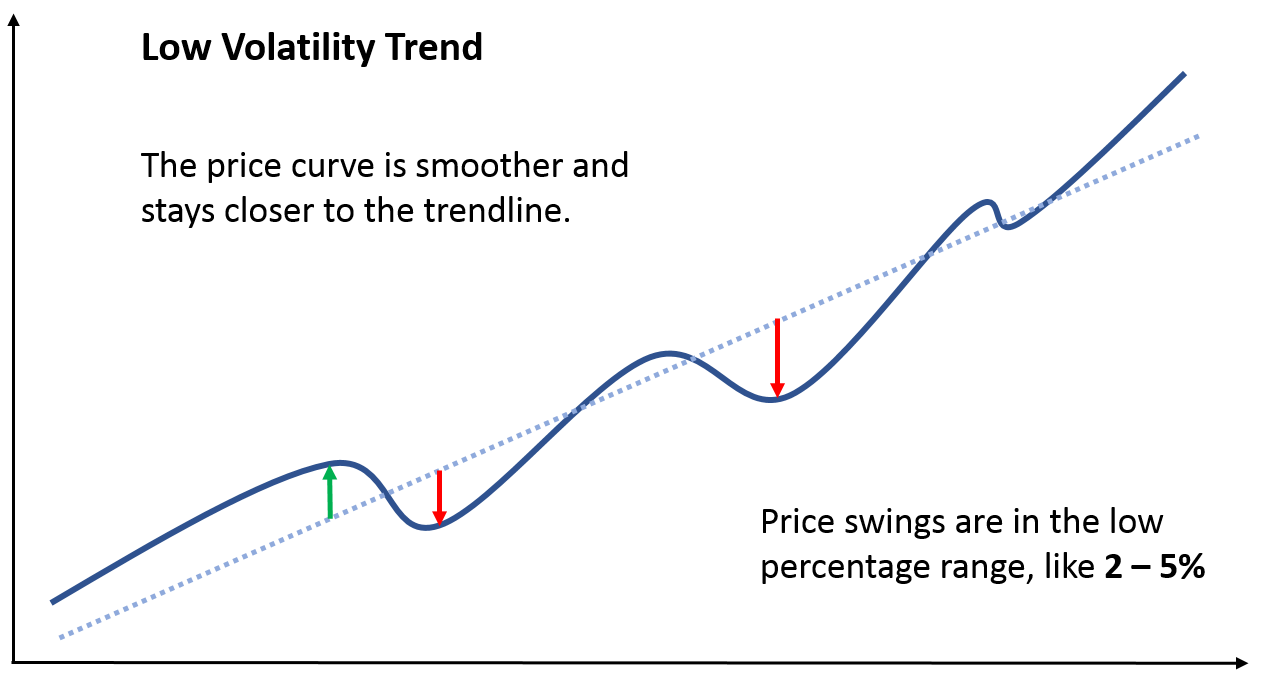
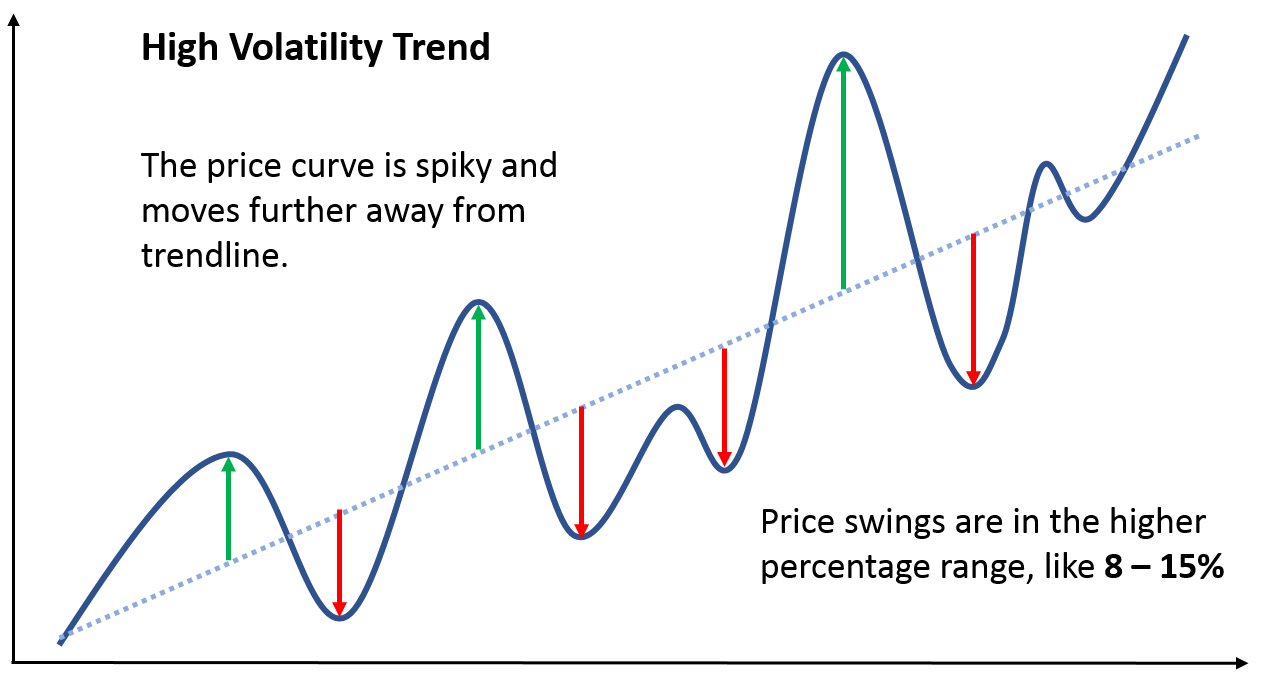
As long as the trend continues, these price swings should not trigger your stop price.
How to detect when the trend is over
Setting a stop price limits your initial potential loss, i.e. if potential uptrend did not happen.
But if the trend happened, how do we know that it’s over and we should take profits?
You already know two systematic ways to detect trends – through breakouts and SMA x-overs like we discussed in the previous lesson.
Just flip it upside down, and instead of detecting an uptrend you can now detect a downtrend.
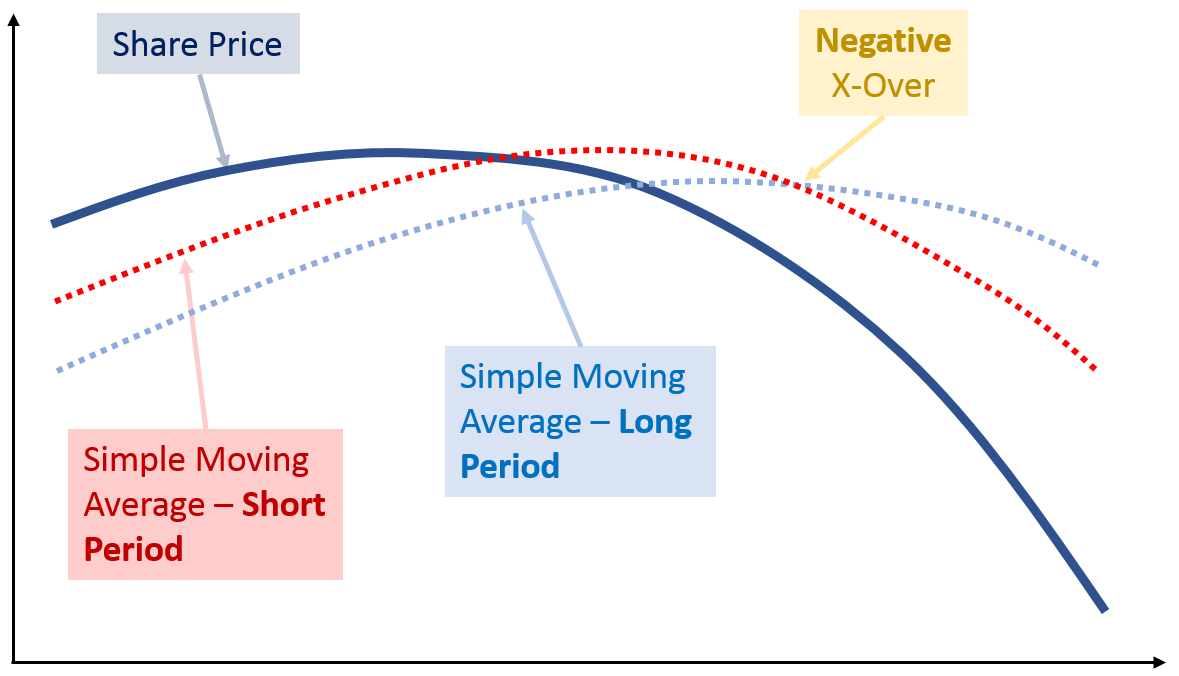
The chart above shows how to detect a potential downtrend through an x-over.
So, one way of detecting the end of an uptrend is by looking out for downtrends.
If you bought a stock some time ago and it developed in a profitable trade (i.e. the uptrend happened), and you detect a downtrend, then sell that stock. That would be a way to close the trade by using an indicator.
Your stop price would stay in place – after all, it’s to limit your potential loss.
Let’s look at an example how that would look like in practice:
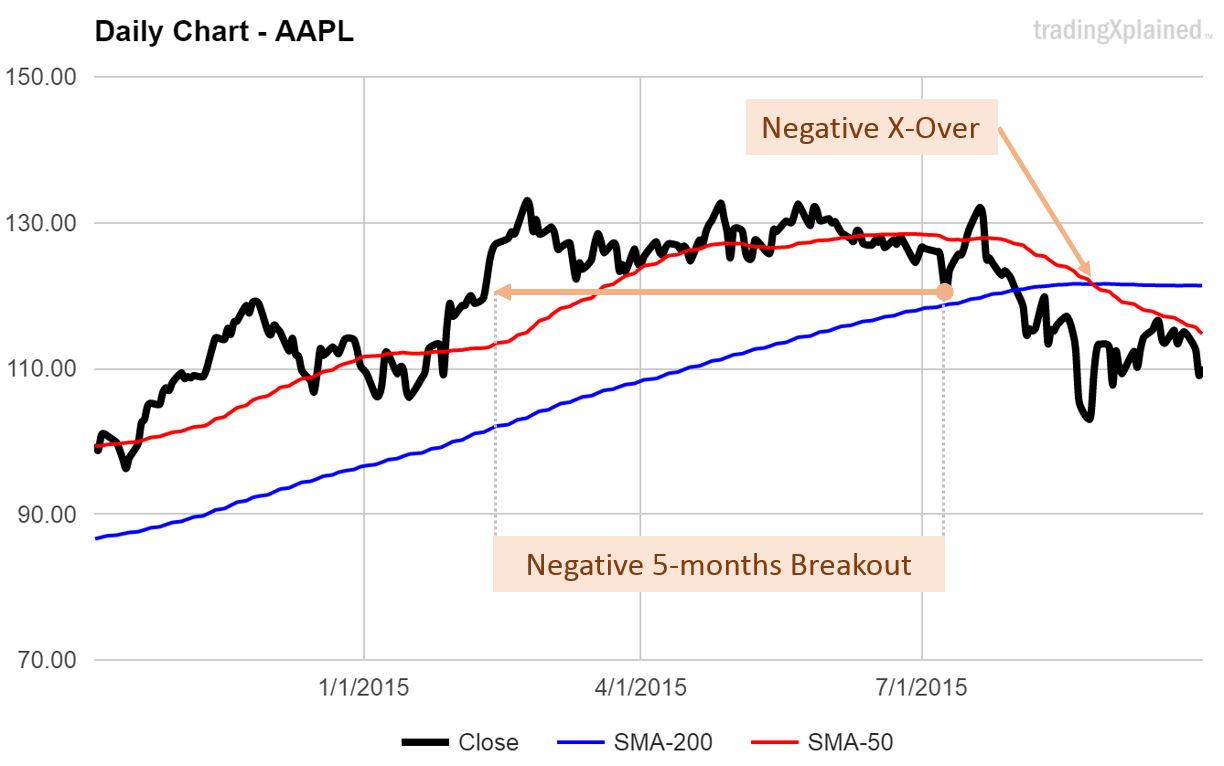
AAPL has been in an uptrend for 8 months, when a negative breakout signal is detected.
It’s a strong one (5 months period), so it could be an indicator of an upcoming downtrend. 6 weeks later, a second signal happens – a negative x-over between the long and short period SMA curves. By that time, the stock price has already fallen considerably.
The question is always: will the downtrend continue?
If yes, then the earlier you sell, the more profit. But if you sell and it was just a short price dip, then you lose money – because you sold although the downtrend did not materialize.
If there are two signals from different systems, then it is a strong indicator that there is indeed a downtrend happening.
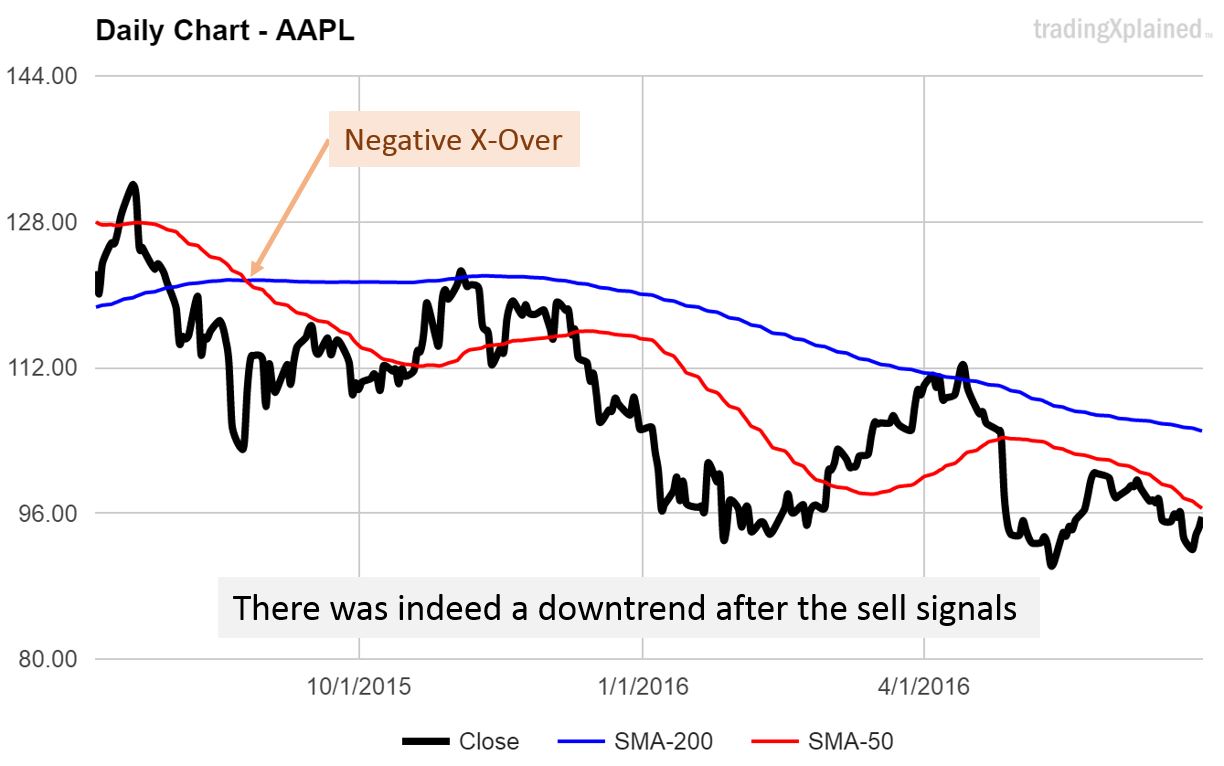
The chart above shows how it continued – and yes, the downtrend happened.
From highest peak to lowest trough of the downtrend is a difference of approx. $40 (from $130 to $90) – a drop of 30%.
A more practical solution
Using a combination of stop price and downtrend indicators works – but is there a more practical alternative?
What if you could just let your profits run and forget about looking for downtrends?
There is a way to do just that. It’s called a Trailing Stop. Let’s first see what it is and how it works.
We already talked a lot about the Stop Price.
The Stop Price is fixed and stays where it is unless you tell your brokerage to change it. In an earlier lesson, I told you what happened to me when I changed my Stop… it was not a good idea because I lost more money than I should have.
But what about changing the Stop Price into the other direction?
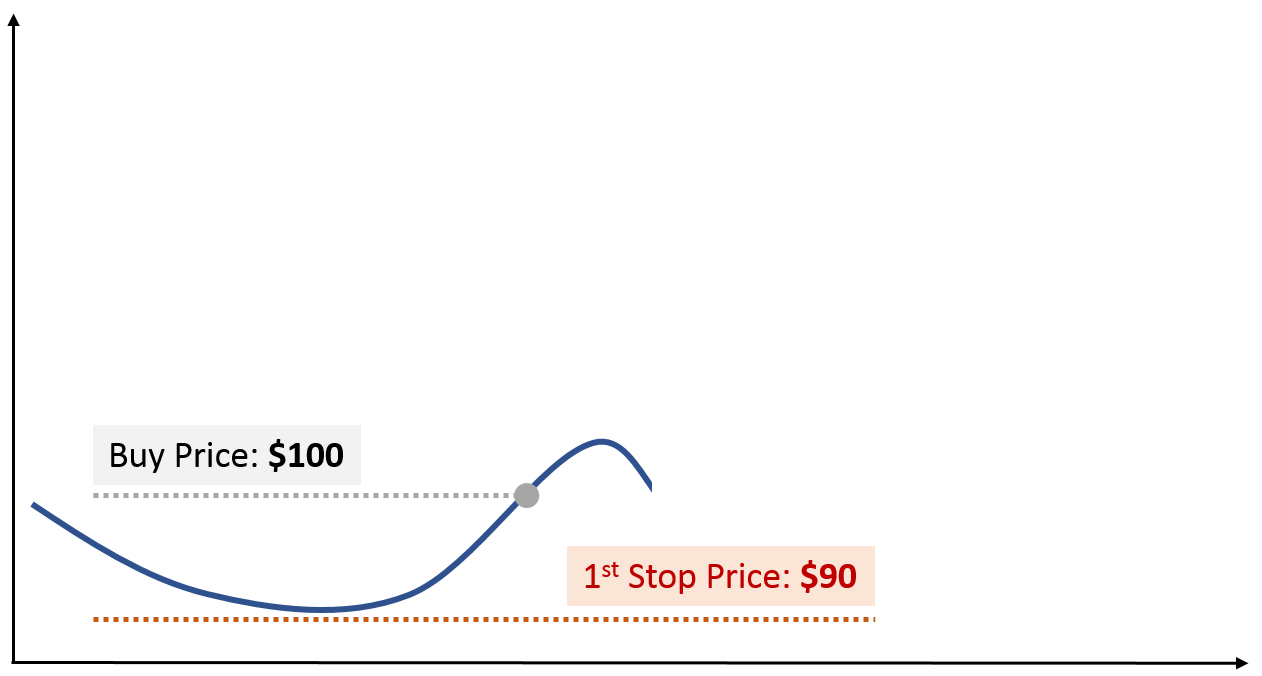
Above is the setup you are already familiar with.
After detecting a trend, we buy a stock at a certain price, here for $100. To avoid losses greater than $10 per stock, we have set our Stop Price at $90.
After initially going up in price, there is a dip. If it continues and reaches our Stop Price, the Stop order will bail us out of this trade at a small loss.
If the trend continues without touching the Stop, then we will continue to “ride the trend”.
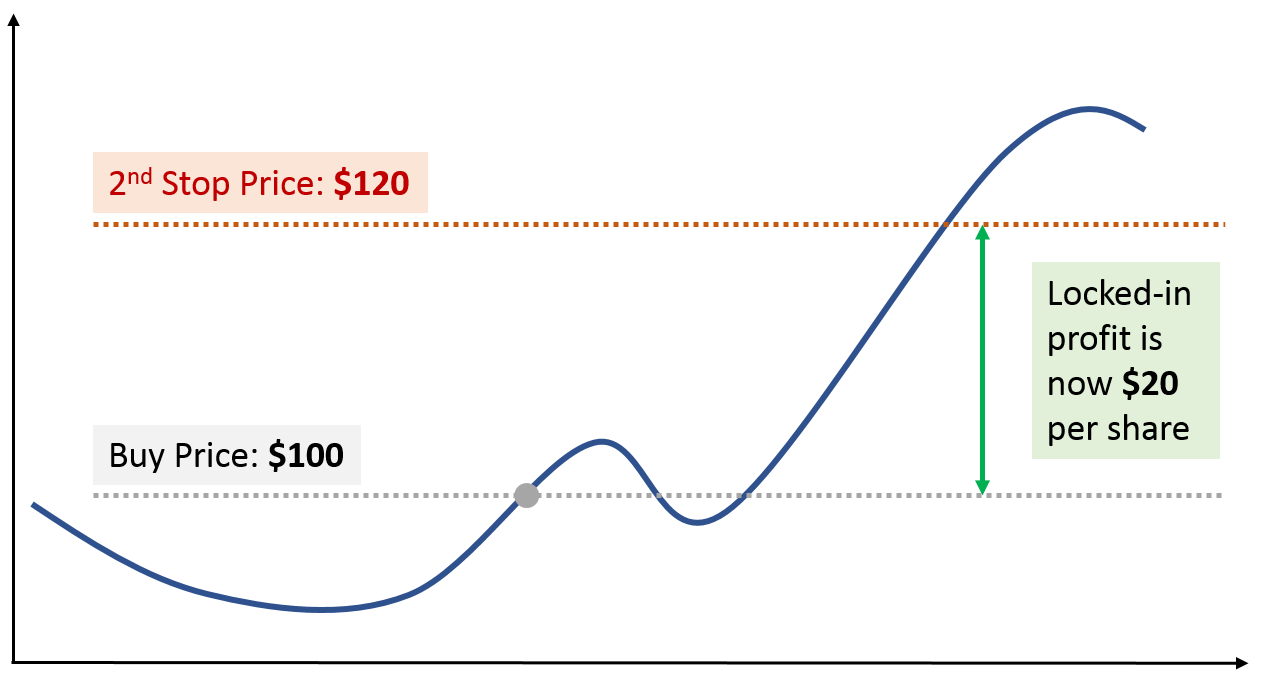
In this example, the trend continued, reaching a new peak at around $130.
That is an opportunity to move our Stop Price: we log on to our online brokerage and change the existing Stop order from $90 to $120.
Now what happened here? Let’s break it down:
- Initial Stop Order was set at $90, limiting our potential loss to $10 per share
- After some initial price dip, the trend developed nicely and reached a new peak at $130
- We increased our Stop Price from $90 to $120.
What does this change do? Two things:
1) It leaves the price room to move up and down (still around $10, as initially set up)
2) It locks in profit: $20 per share.
It means that we secured a return of $20 per share. That’s twice as much as we were willing to risk.
So, what will happen next? Either the price continues to drop and we sell the stocks automatically at $120, making a profit of $20 per share.
Or, the trend continues and we might shift the Stop Price again later, locking in more profit.
How did we decide about moving the Stop Price?
By looking for new price peaks and using them as the reference. We know our initial distance between the buy price and the Stop price – we just shifted it upwards to the new price peak.
And that’s exactly what a Trailing Stop does:
it uses the new highest pricing as the reference and shifts the Stop automatically higher as per the set price difference. And it does it in real time – so there is nothing you need to do by yourself.
There is no need for other trend indicators
You noticed that we never looked for a trend reversal through breakouts or x-overs.
Our sell decision is based on the difference between the buy price and initial the Stop price.
The trailing stop order shifts the Stop upwards with the trend – and if the trend reverses too much (by the price difference), then the stock will be sold automatically.
That works very well and helps to lock in profits without the need to check your portfolio all the time. Instead of setting a normal Stop order, use a trailing stop order and let your profits run.
Using a trailing stop is the most low-maintenance solution ever – and it helps realizing profits automatically, while at the same time limiting your potential losses.
What about trend reversal indicators?
You can still use them and manually sell – that’s fine. But if the price drops by the amount you have set with your trailing stop, then these indicators are very likely to show up anyways (a 10% price drop will show up as a breakout and x-over in most cases).
So, what’s not to like about the trailing stop?
While it is a very practical solution, it’s not fool proof. There are circumstances where it does not work so well, for example:
- If you set your trailing stop to $10 and the price dips by $11, and then recovers, then you are out of that trade, although the trend did continue afterwards.
- If the stock market experiences a sudden dramatic drop, just to recover immediately – as happened in the “Flash Crash” in May 2015, but there were other incidents, too. If that happens, your stops will trigger and bail you out of your trades, while minutes later, the pricing might have recovered – but you are not in the game anymore.
- If you set it to close to the noise level of the price – you will frequently bail out of your trades unnecessarily.
These things happen – but overall, I believe that the benefits outweigh the problems.
Trailing stops have served me well, locking in profits and saving me from major losses countless times. They are also incredibly efficient; once set, you can lean back and only check periodically.
If you are in a trade for a longer time, you might need to renew the order – your brokerage might have a time limit on orders (like 3 months or so). They will email you about expiring orders – then you can follow up and renew them, or change them if needed.
How are the “finance experts” doing it?
Tom Basso, like most market wizards that shared their knowledge, uses stops all the time. He follows the golden rule of trading:
“Cut your losses short and let your profits run.”
Here is what some other market legends have said about using stops (from van Tharp’s book, “Trade your Way to Financial Freedom”):
William O’Neil: “The whole secret to winning in the stock market is to lose the least amount possible when you’re not right.”
Jesse Livermore: “Investors are the big gamblers. They make a bet, stay with it, and if it goes the wrong way, they lose it all.”
You might argue that Warren Buffet is an exception to Jesse Livermore’s wisdom… and he is! But how many Warren Buffets are there? 🙂
Summing it up
No trading system is complete without a strategy on when to sell.
Using stops, trailing or otherwise, is a great way to take profits and to protect your portfolio from losses. Before entering any trade, make sure you know what should be your stop price. When you create the buy order, create the stop order, too.
Now get the worksheet and follow it through to update your trading system accordingly.
In the next lesson, I will discuss risk management – make sure you don’t miss it!

Get Updates!
Subscribe for FREE
Browse by Topics

What to Invest In
Make the most out of investing by starting early.
Stock Trading 101
From Novice to Profitable Investor in 8 simple steps.

Reduce your Risks
Dramatically improve your trading performance with the Slash Formula.
Get the Lesson 5 download:
Click on the image or button below to get the 14-pages PDF file.
The lesson worksheet explains in multiple scenarios how to implement stops into your trading system:
- Scenario 1: the trend develops
- Scenario 2: the trend fails – small win
- Scenario 3: the trend fails – small loss
- Scenario 4: the trend fails – large loss
JOIN OUR FREE NEWSLETTER
Get the latest trading techniques right into your inbox.


0 Comments