START TRADING 101 | Lesson 1

How to become a profitable Trader in 8 Simple Steps
First of all: Welcome to the Stock Trading 101 course!
This is the first lesson of a total of 8 lessons and it will cover basic principles of stock trading to get you started. It’s an introduction and overview; I will outline all topics, but none of them will be covered in detail yet.
If you have any questions, leave a comment at the end of the post or send an e-mail to support@tradingxplained.com!
Now let’s dive right in!
What you can do after this lesson
In this lesson, I will give you an overview of what stock trading is all about.
After you completed reading this post, you will be able to decide if investing in stocks is for you or not. But even if you are convinced already, just keep reading!
I will explain a few basic yet fundamental concepts and provide a summary of what to expect from each following lesson.
What this course does and does not do
Managing expectations is an important concept, especially when trading stocks 🙂 but in this case, it’s about this course.
Stock trading is often perceived as speculative, irrational and risky. Where fortunes are made as fast as they are lost again.
And where the winning trader is the one that has the most information about the “next big thing”. Or if you don’t “buy it now” you will lose the deal of a lifetime…
Nope. It’s not like that AT ALL. But more on that later.
What this course is NOT about:
- The next “hot stock”. I neither know nor try to predict the future. That’s why I will not recommend which stock to buy, EVER. But guess what… you don’t need that to trade profitably!
- Getting rich quickly. If that would work, suddenly everybody would be rich. Look around you…
- A silver bullet for risk-free growing your investments. There is no such thing as a risk-free investment. No exceptions.
So, what IS IT about?
After you finish this course, you will be able to create your own, systematic way to invest in stocks, by
- Building a robust trading system that fits your personality and lifestyle
- Knowing when to buy which stock, and when to sell it
- Taking calculated risks that maximize your gains and minimizes your losses
In a nutshell: you will be able to trade stocks to grow your investment in an efficient way, even if you have a busy schedule, are on frequent business trips, etc.
There are as many ways to trade as there are traders…
Because we are individuals – with different beliefs, needs and wants – everybody has his own trading style that fits “best”.
You will need to discover yours to become a successful trader… but not to worry. I’ve got your back on that one!
Over the years, I developed my own ideas and beliefs that work best for me. Here are some of them:
- Forecasting rarely works and is not necessary to be profitable when trading stocks
- Price trends tend to continue
- Humans are emotional, irrational and biased (which can be good and bad)
- Successful traders are calm, thoughtful, don’t make snap decisions and stay cool under fire
- Trading works best if using a trading system that fits the trader’s personality
- A system based approach minimizes human errors
- Everybody can learn how to trade stocks efficiently and profitably by using a trading system
- 80% of success in trading is about risk management
And so on. There are countless things I believe about stock trading… and I will explain in the course how I developed these beliefs.
And yours will be different – that’s how it should be!
I will talk more about trader’s psychology in a later lesson. But first, let’s have a look at some fundamentals. I promise to keep it as low-tech as possible 🙂
Stock Charts
Stock charts show the price history of a stock.
They come in all shapes and sizes, with many options to change the look, time periods, colors and curves to display etc.
Below is an example from stockcharts.com.
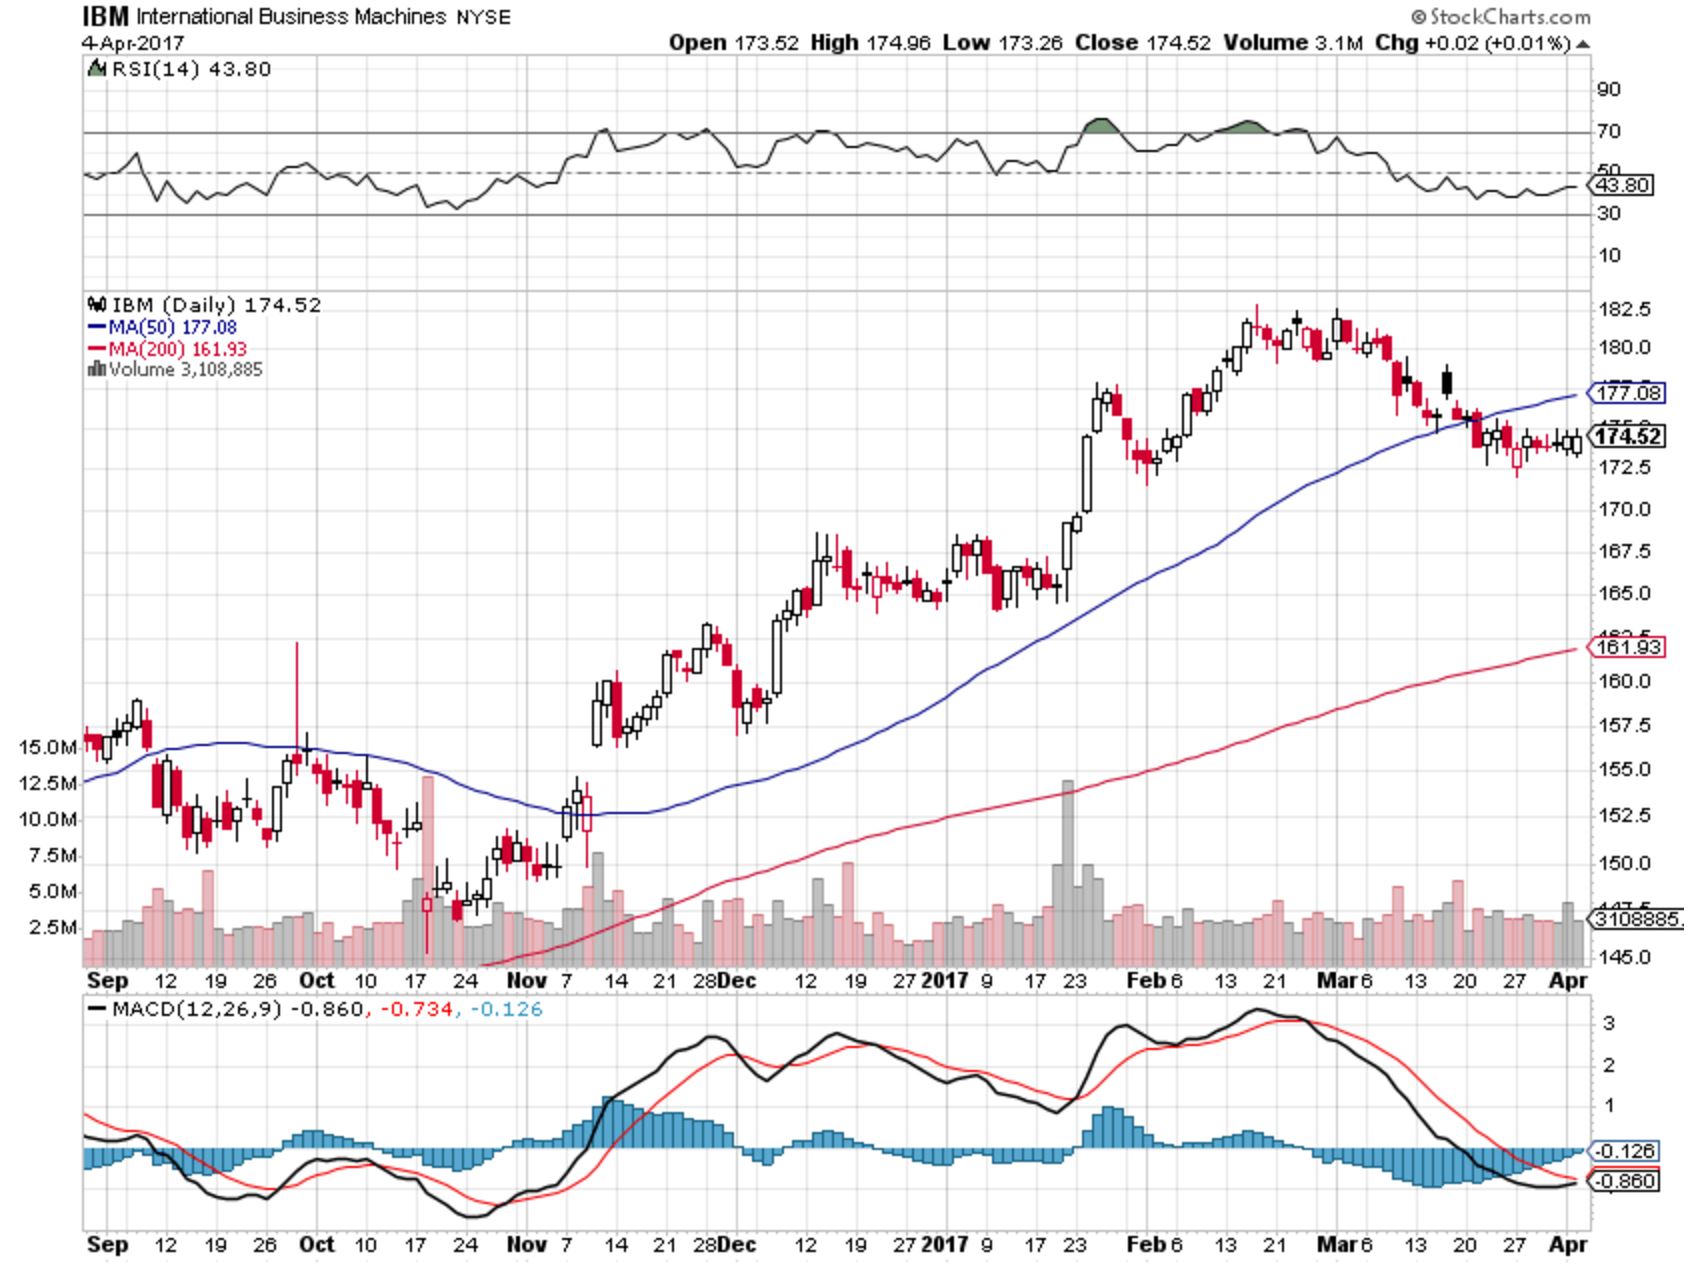
This chart shows several months of price history of IBM. This type of chart is also called “Candlestick Chart”.
It also has additional curves above and below the price history. These are called “indicators”; these are additional curves derived from the stock price.
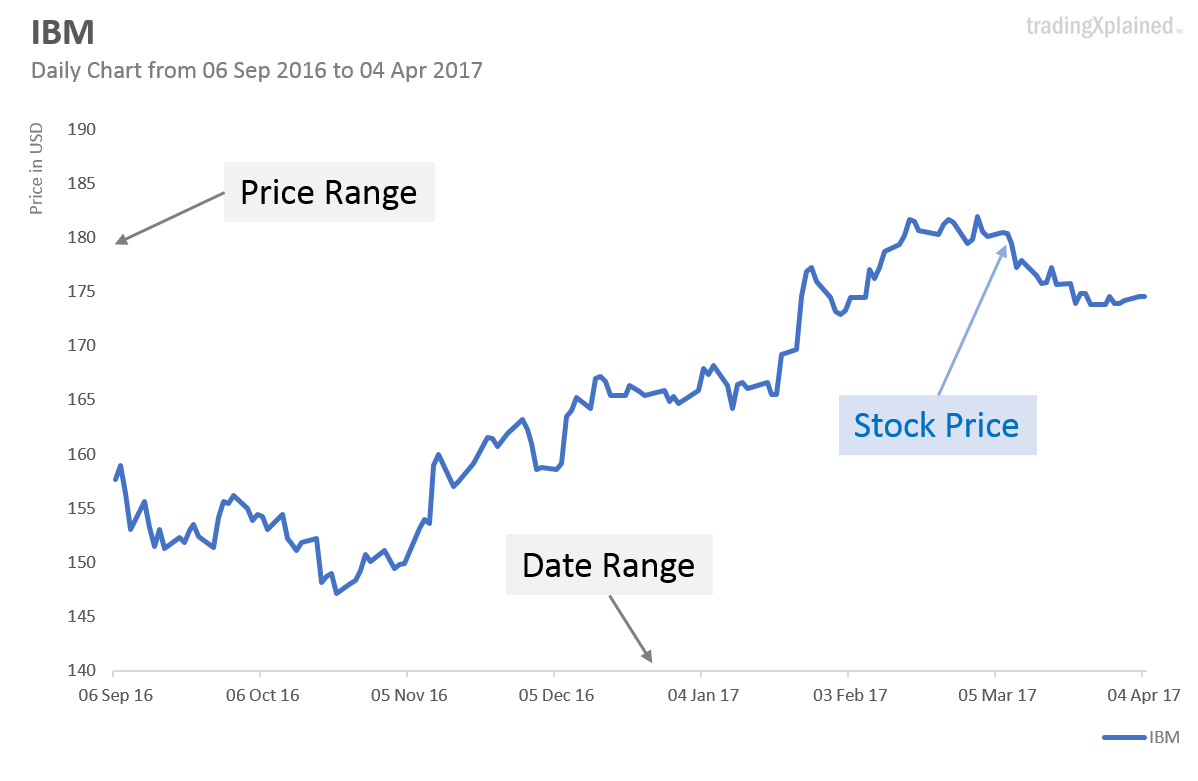
But these charts can be confusing at the beginning, which is why we will start with a simplified version. The below chart shows the same data, but only displays the history itself, without the bells and whistles.
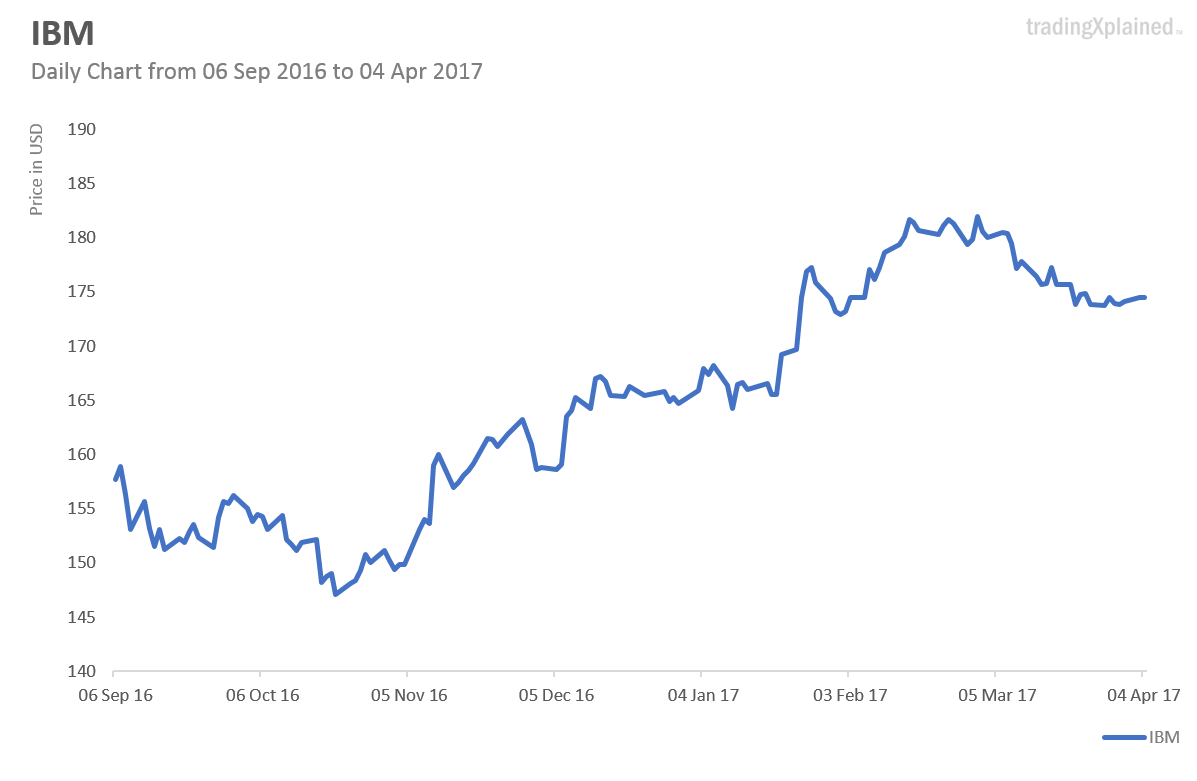
That’s better. All the distracting stuff is gone, leaving only the essentials.
The most important items are:
- Price history (one data point per day – it’s a “daily” data chart)
- Date Range – so you know from when to when the history goes
- Price Range – so you know the price levels and changes over time
Nearly everything else can be derived from this data if needed. Later we will add some curves to help to decide when to buy and sell stocks.
Buy low, sell high…
You might have heard the “common wisdom” already on how to succeed in the stock market:
“Buy low, sell high.”
That sounds a lot like “if you want to lose weight, eat less”. Simple. But not easy. However, while oversimplified, it’s actually spot on. So how to do it?
I will explain, but first…
Question: If all information you had about a stock was the below price curve, should you buy it?
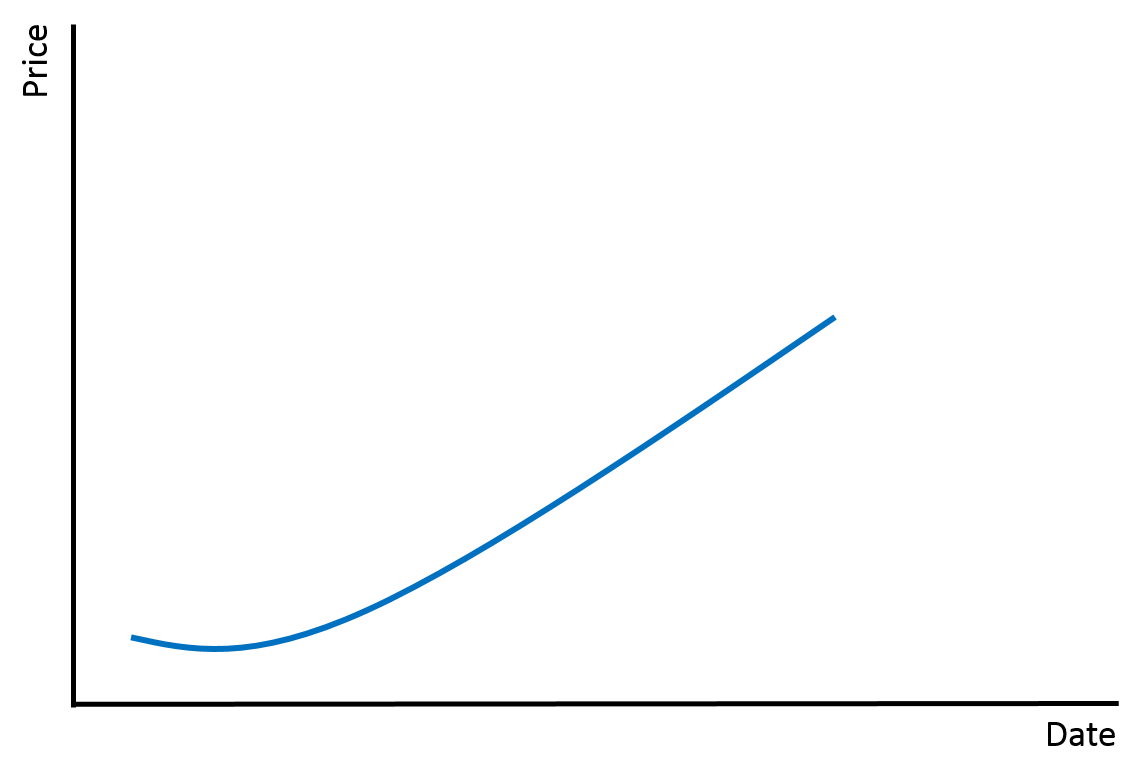
Don’t overthink it 🙂 Remember that’s all the information you’ve got…
…
..
.
And the answer is: YES. You should buy it.
All you know is that the price is going up right now. If you buy now and the trend continues… well done, you might have a winning trade…
But what to do if you are wrong and the trend changes?
Answer: Then you admit that you were wrong and sell, accepting a small loss.
And that’s where 90% of beginner traders fail.
Beginners tend to keep the losing trades because it is psychologically difficult to admit being wrong. It hurts being wrong!
But insisting on “being right” while prices continue to drop is incredibly expensive… and in the worst case will lead to bankruptcy. So, swallowing one’s pride is a useful skill to develop for traders!
So, when to sell if the trend is against you? Decide this before you buy the stock!
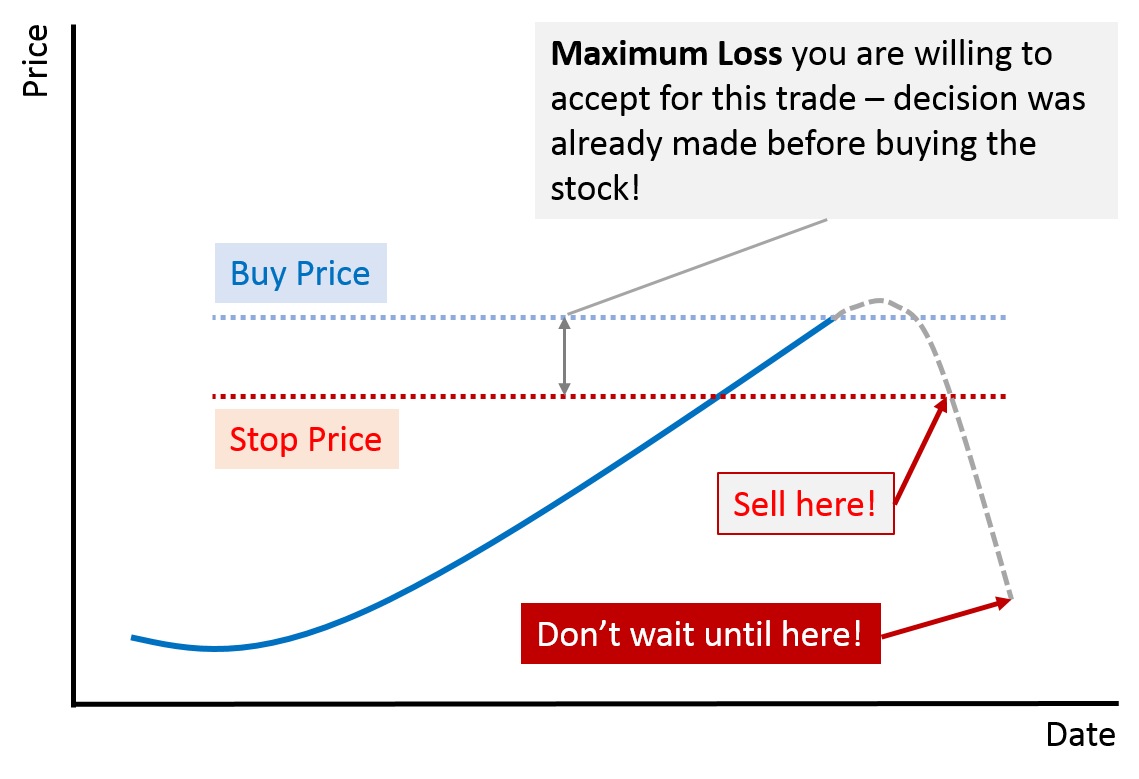
The price that you decide on to “bail out” is called the Stop Price. In a later lesson, I will explain exactly how to set it; for now, the important part is to understand two things:
- Decide on a Stop Price before you do the trade
- Should the price reach your Stop Price – ACT and sell!
Let your profits run
Another important concept is to LET PROFITS RUN.
It means: don’t sell once you see a little profit from a trade. Ride the trend as long as there are no obvious signs of a reversal.
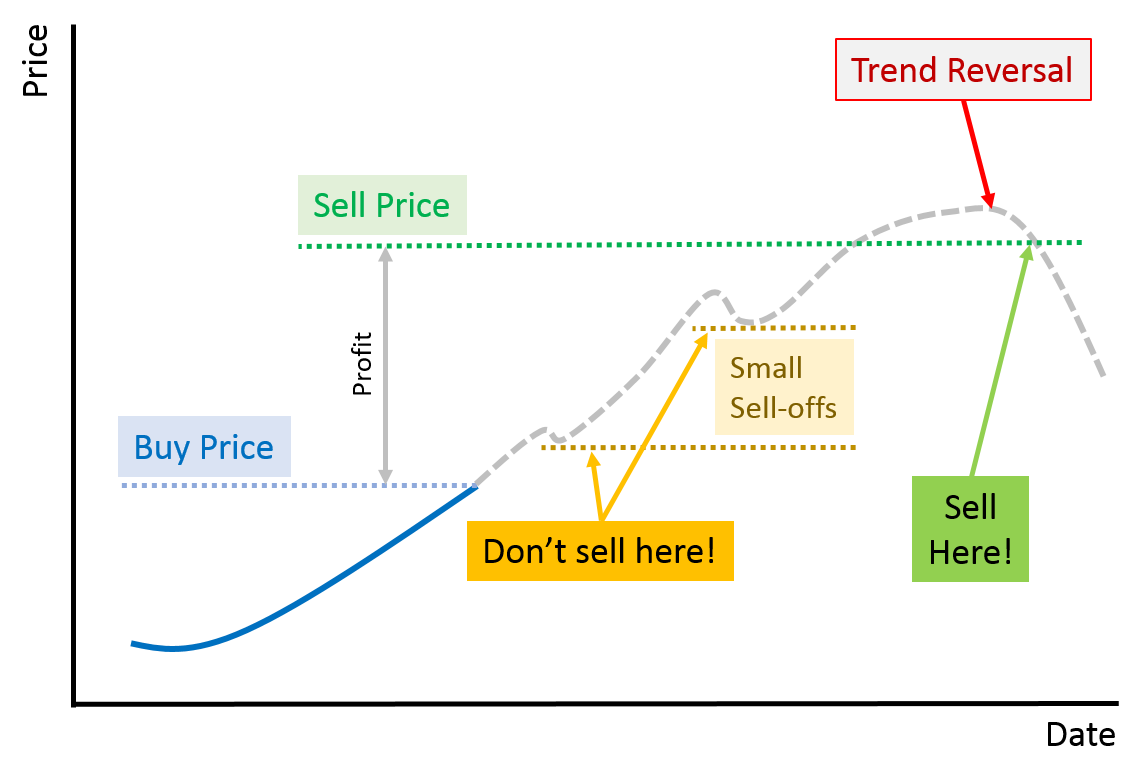
If you sell at the first sign of a small dip in price, or just because you are “in the plus”, then you miss out on the full potential of the trend.
How to detect trend reversals will be part of another lesson – for now just remember to let profits run as long as possible.
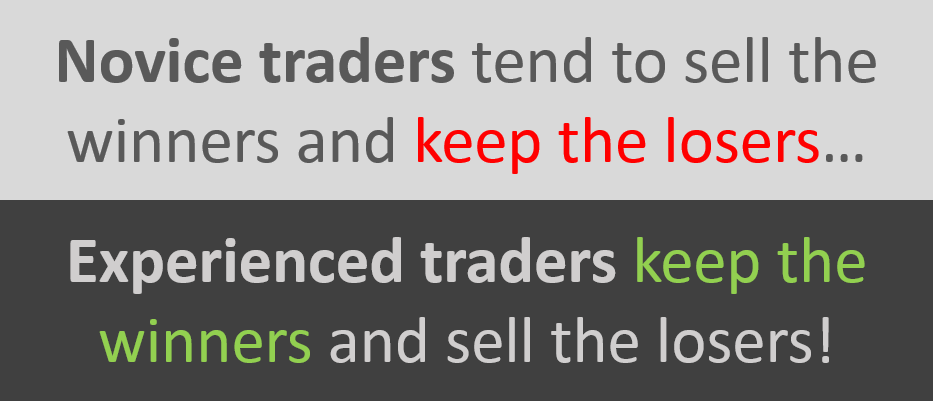
One of the most common beginner’s mistake is to sell the winning trades early and keep the losing trades.
Successful traders do the exact opposite: they discard losing trades quickly and keep the winning trades until the trend reverses.
This concept can be summed up with “Maximize your gains, minimize your losses”. Which leads us to another fundamental concept: Expectancy.
Expectancy
Expectancy means “average gain per trade”.
There are other definitions, but this one is easy to remember. A trading system with a positive expectancy will grow your money, while one with a negative expectancy will decrease it.
Here are some examples, based on flipping coins:
Zero Expectancy
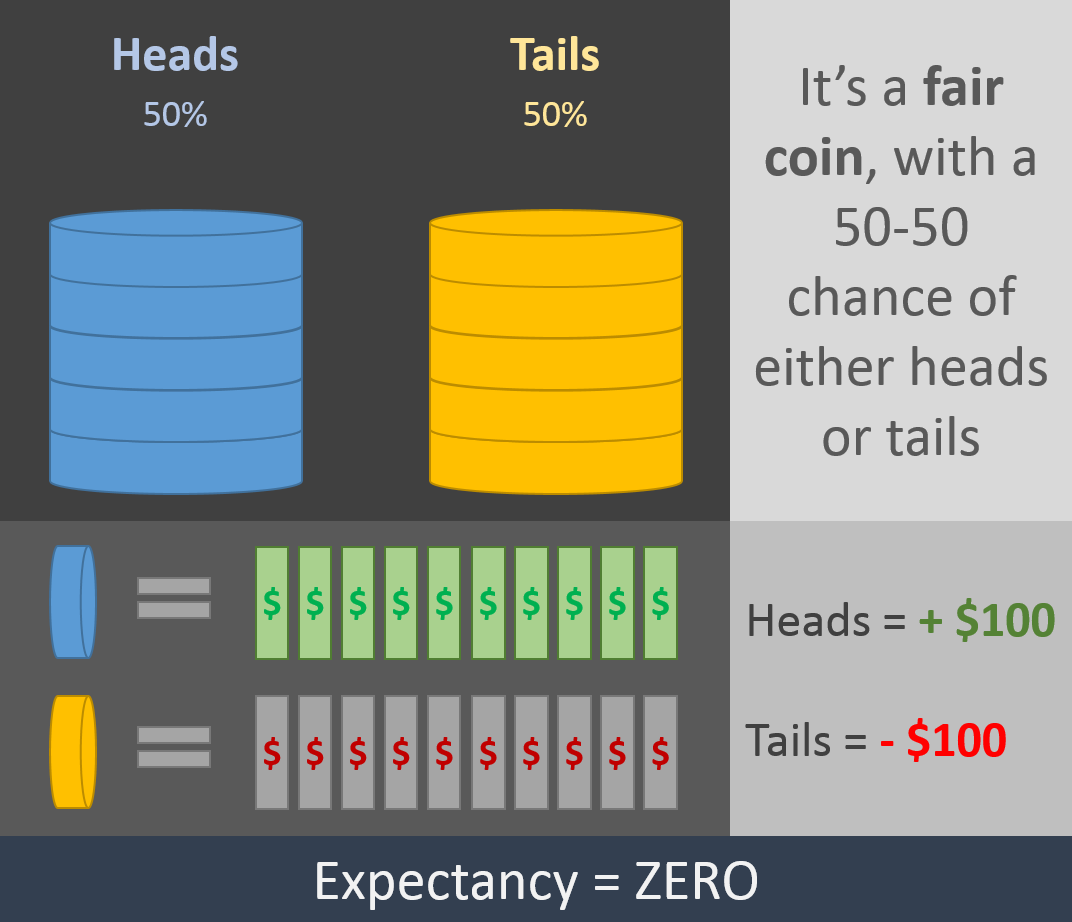
A game where you flip a fair coin gives you a 50-50 chance of winning.
If you gain for each winning game $100 and for each losing one you lose $100, then your expectancy is zero… because on average, you gain as much as you lose.
Such a trading system is not going to make any money in the long run.
Positive Expectancy
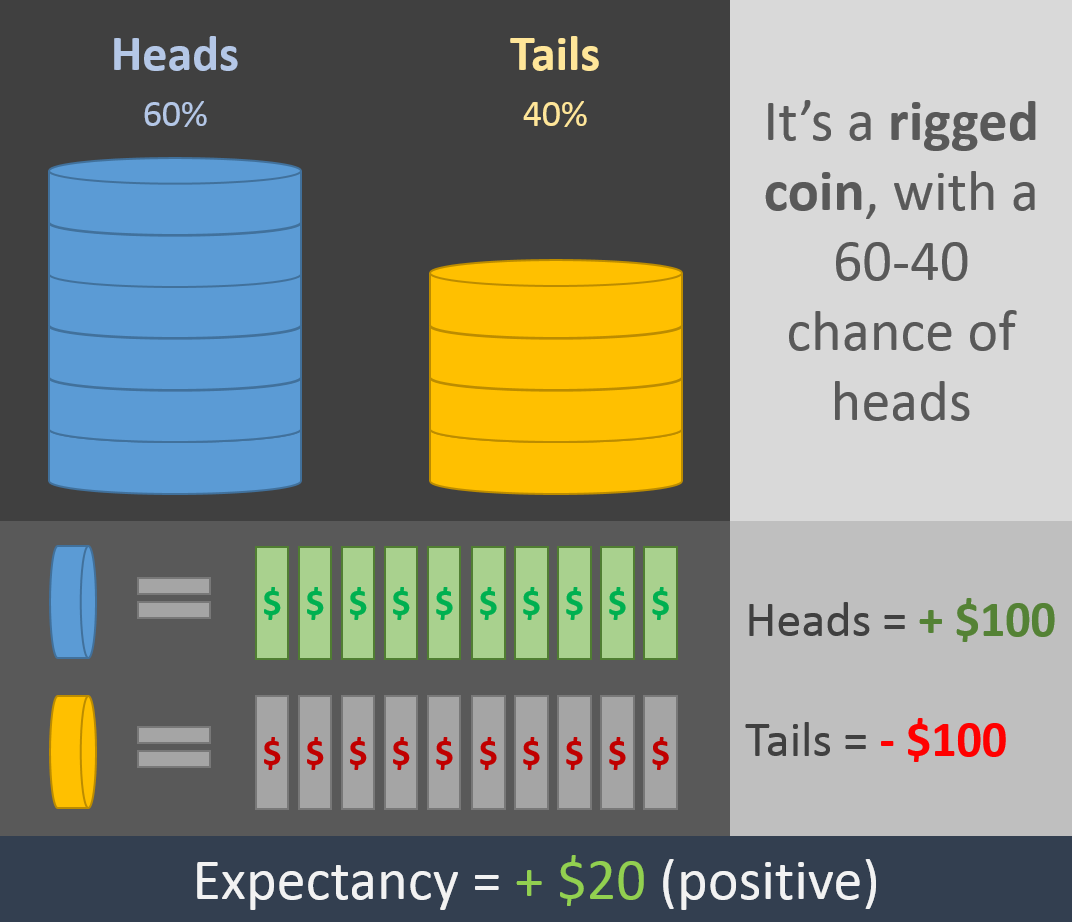
What is your expectancy if you win 60% of the time (because the coin is rigged!), and your wins and losses are still each at $100?
Expectancy = 0.60 x $100 – (1 – 0.60) x $100 = $60 – $40 = $20
So, on average you win $20 per game; that’s a system with positive expectancy.
Keep in mind that you will still have losses! 60% chance of winning means a 40% chance of losing – on average! But you can have multiple losses in a row.
A good trading system has a positive expectancy in the long run. Losses will happen frequently, but overall the value of the portfolio will grow.
That’s exactly how casinos make money, by the way! For them, and for a stock trader, losses are simply the cost of doing business.
Negative Expectancy
Winning a game 60% of the time sounds great! But how important is it to win often?
Most of us would immediately say that it’s extremely important. After all, we learned that kind of stuff already at school. If you score above 90% of the class in an exam, you got an A… above 70% it was a B… etc.
That means, winning is good, losing is bad. Right? Well… not necessarily with stock trading.
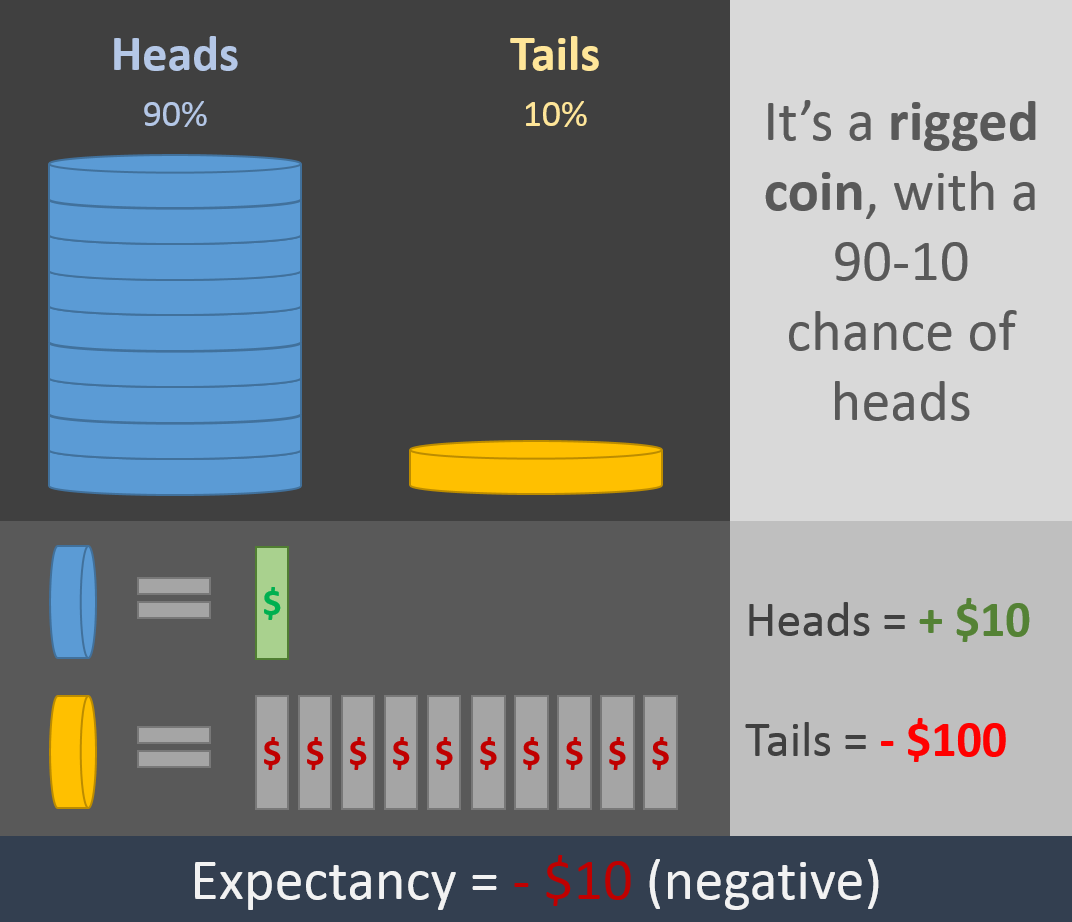
Let’s check it out.
What if you flip a coin and you win 90% of the time… and each time you win you gain $10. But if you lose… you will lose $100. Is it a good game to play?
Expectancy = 0.90 * $10 – (1 – 0.90) x $100 = $90 – $100 = -$10
Oops. So, you are winning nearly all the time… but you are still losing money in the long run. That’s a system with negative expectancy. You want to avoid those at all costs!
Does that sound familiar? It should… it’s like selling stocks that show a small gain while keeping the losing trades until the losses become unbearable.
Trading Results Example
Enough about coin flips… how would real trading results look like? Below is an example:
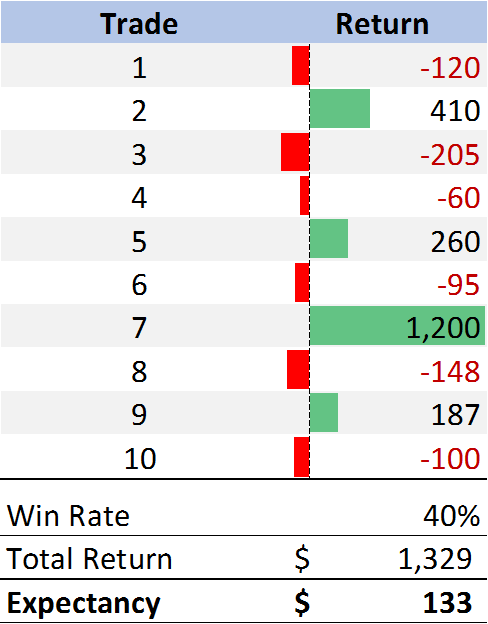
Out of 10 trades, 6 were losing trades and 4 were winning trades.
Despite the win rate of only 40% (means, less than half of the trades are winning trades), the system has a positive expectancy. On average, each trade makes $133.
The reason for the positive expectancy is that the losing trades were kept small (that’s where the Stop Price does its job) and the winning trades were left to run… resulting in fewer, but higher winning trades.
How would the value of the portfolio change over these 10 trades? Let’s have a look.
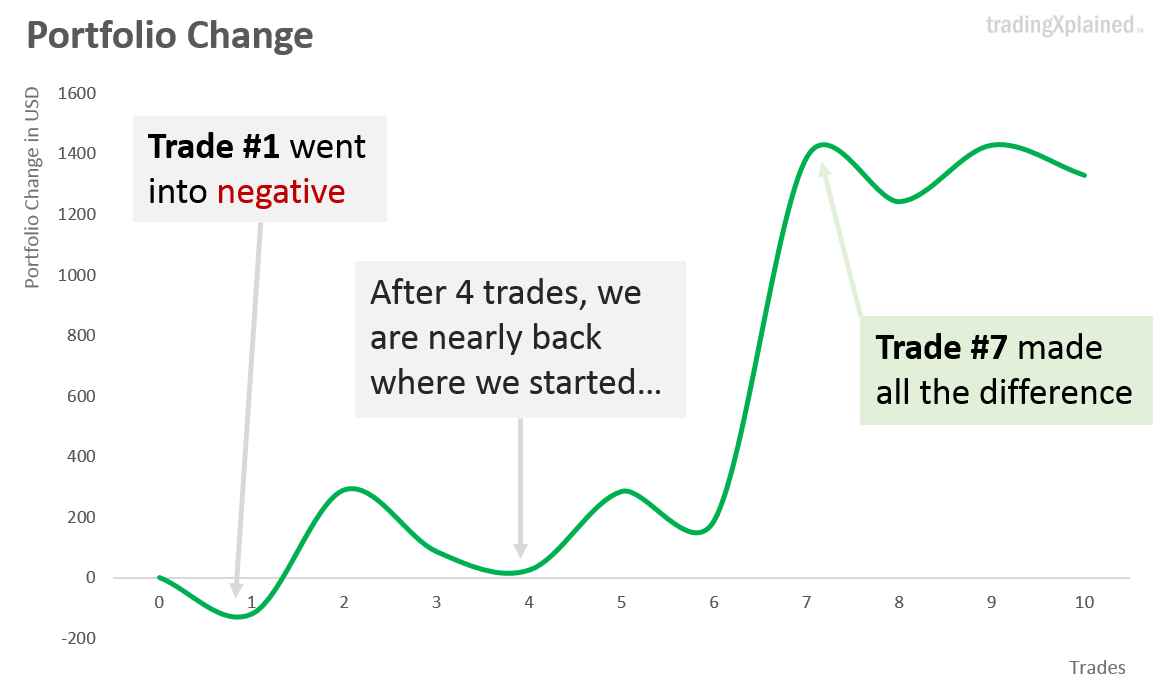
The first trade already brought us into the minus… just to recover afterward… yay! But then, the next 2 trades brought us back down to nearly zero. What made the difference in the end?
One winning trade was exceptionally high in comparison to the others:
Trade #7, with a gain of $1,200. That is nearly 3 times higher than the next best trade (#2, at $410).
That is a typical occurrence of such a trading system.
One or a few trades can make most of an entire year’s gains. That’s why it is very important to capture as many opportunities as possible… you don’t want to miss out on the big one!
Quick recap of this lesson
We have covered a lot of ground by now, let’s quickly recap before moving on to the lesson overview. Here is what we have learned so far:
- How Stock Charts look: keep it simple with easy to read line charts
- How to make money with trading stocks: let profits run and discard the losing trades quickly
- Expectancy and the importance of having a trading system with positive expectancy
Up next: the lesson overview!
Course overview
Lesson 2 is all about YOU.
Your personality, your goals, and your lifestyle. Every trading system needs an overall strategy to work well, and every strategy depends on a trader’s goals.
Why does lifestyle have to do with trading you might ask? It’s more important than you think!
Imagine you have created a trading system that has great potential to grow your portfolio… but it is very time critical. Every trading day you need to sit at your trading software, exactly when the markets open… your system’s success depends on it.
What if you have a busy job with many schedule changes, business trips, urgent meetings? What if you cannot attend to your trading system for several weeks in a row, for whatever reason?
It will become a frustrating and painful exercise (and a potentially expensive one).
And that’s why your trading strategy must match your lifestyle, your job and your countless other duties that take your time. It’s about finding out what works best for you.
It will also be about FINANCES.
What are your financial goals? How much do you want to invest? Will you need to withdraw money frequently? Or can you fund your account regularly?
And then we will discuss PSYCHOLOGY.
Why we tend to make certain mistakes when trading and how to avoid them. Based on that, we will develop some RULES that will help with succeeding as a trader.
It’s all about EFFICIENCY.
There are many thousands of stocks to choose from and nobody has time to go through all of them (unless it’s your job and you have a lot of computer power at your disposal). Narrowing down to a niche is essential.
I will give you an overview of what is available in the stock market and what are important things to consider when choosing your MARKET SECTOR.
We will discuss how to choose a market niche that matches you and how to create a SHORT LIST. The idea is to spend 15 minutes or less per day once your trading system is up and running.
Now that you have your market niche selected, as well as a short list, we drill down to the details about how to CHOOSE which stock to buy.
I will discuss using FILTERS and INDICATORS that will help you narrow down your short list of stocks. I will also cover important DOs and DON’Ts for stock picking.
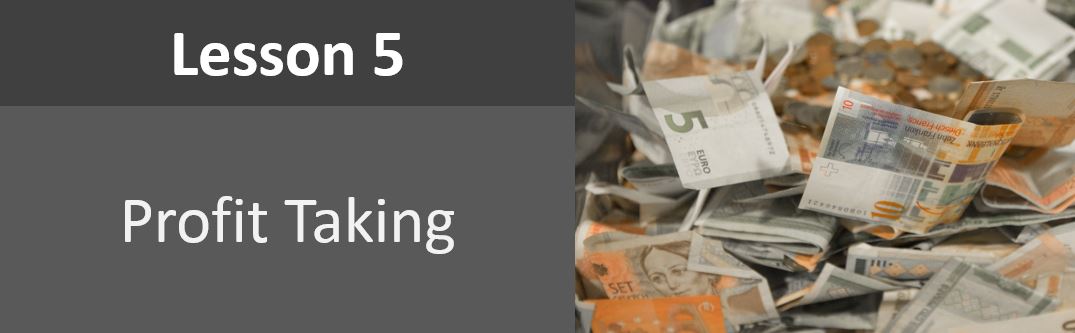
If Lesson 4 was about how to choose and buy a stock, this lesson is about deciding when it is the right time to sell and take PROFITS. This is done by setting up an EXIT STRATEGY.
I will explain how “market wizards” are taking profits and what I am doing in my own trading system.
Then I will show you how to generate ORDERS to open and close your trades.

This is one of the most important lessons… it answers the question “HOW MUCH?” to invest and how to manage your trading risks.
It will teach you how to take calculated risks and how to MINIMIZE EXPOSURE to large losses.
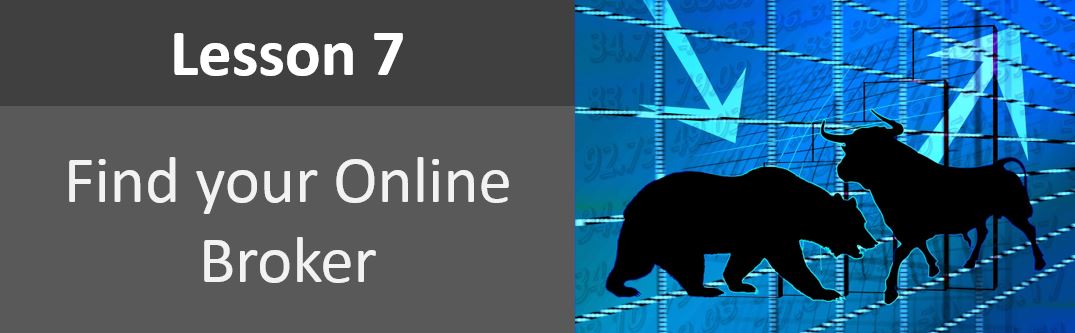
There is no trading without a broker. I will explain what to look out for when selecting an ONLINE BROKER.
I will also discuss the importance of TRADING COSTS. In the Worksheet, I will give step-by-step instructions on how to create a trading fee simulator to make comparisons between broker firms.
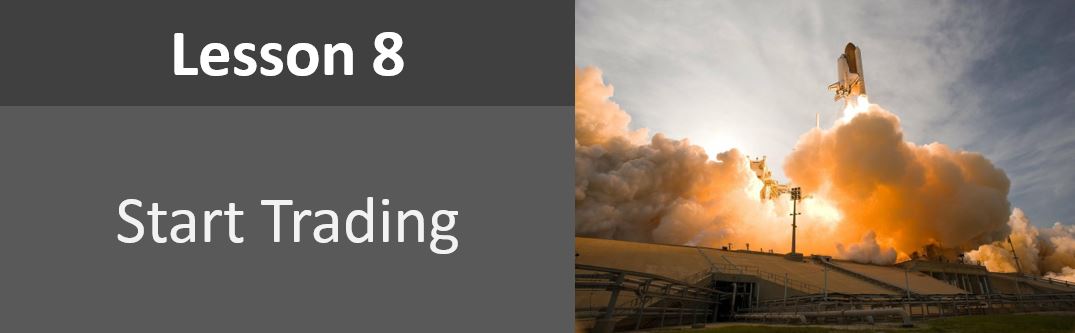
In this lesson, we will put it all together. Afterwards, you will have your OWN TRADING SYSTEM ready for action.
I will also discuss how to get started with your first trades and the importance of RECORD KEEPING.
That’s all for now…
We finished the first lesson… phew 🙂
By now you should have a better idea what stock trading is all about! So now…
- Get this lesson’s cheatsheet and print it out. Read it frequently until you know it inside out. It will serve you well later… promised!
See you in the next lesson!

Get Updates!
Subscribe for FREE
Browse by Topics

What to Invest In
Make the most out of investing by starting early.
Stock Trading 101
From Novice to Profitable Investor in 8 simple steps.

Reduce your Risks
Dramatically improve your trading performance with the Slash Formula.
Get the Lesson 1 downloads:
- Course Roadmap (PDF file): a 1-page course outline where you can mark down your progress.
- Cheat Sheet (PDF file): a 1-page reminder about the trading fundamentals.
Click on the images or links below to get the files.
JOIN OUR FREE NEWSLETTER
Get the latest trading techniques right into your inbox.


0 Comments